Alt season Can start from this zone finally altcoins market cap reached at crucial support area, expecting successful retest from trendline, and this blue area, the question is why im expecting alt season from here, b,coz multi year symmetrical triangle got cleared, and market came for retest, healthy correction happens in markets often the time, and currently market testing crucial support area, successful retest with strong momentum can lead massive alt season from here
TOTAL3 trade ideas
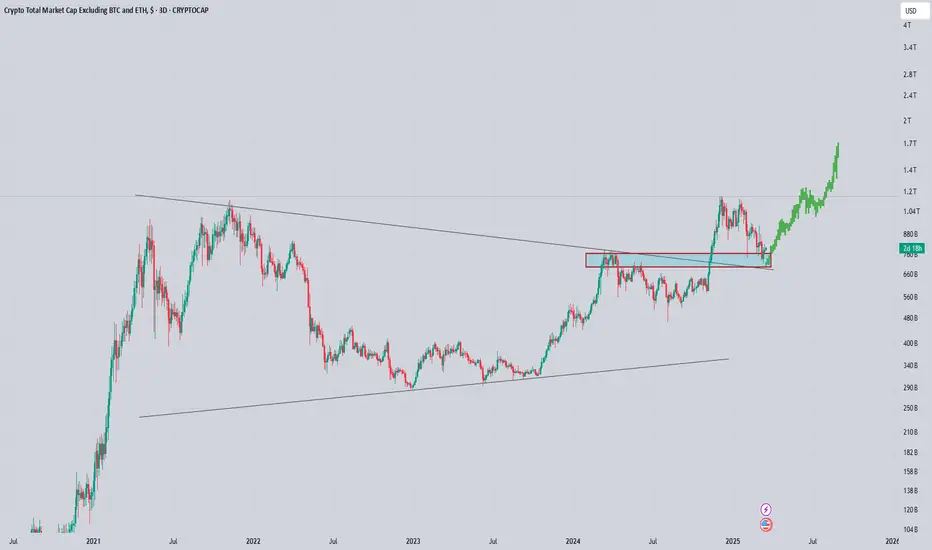
Total3 Market Cap Excluding Bitcoin and EthAs of March 14, 2025, the TOTAL 3 index, tracking the combined market capitalization of altcoins excluding Bitcoin and Ethereum, is following a well-defined ascending trend. Recently, the market cap dipped to $717 billion, where it found strong support at the lower boundary of an ascending channel—a trend line stretching back to October 2023. This support level aligns with the recovery from a sharp spike in early 2024, reinforcing its role as a key structural floor over the past 17 months.
After bouncing off $717 billion, TOTAL 3 has risen to approximately $750 billion, where it now appears to be consolidating. This stabilization phase, likely lasting a few months, reflects a period of accumulation as altcoins gather strength along the lower trend line. However, the upper boundary of this ascending channel suggests significant upside potential. If the bullish trend persists, TOTAL 3 could target the top of the pattern, reaching a market cap of $1.3 trillion. This projection is based on the channel’s historical slope and amplitude, which has guided altcoin growth since late 2023.
A move to $1.3 trillion—nearly doubling from current levels—could be triggered by a combination of seasonal momentum, broader crypto market catalysts, or renewed retail and institutional interest in altcoins. For now, the $750 billion consolidation serves as a critical base, with the trend line providing a springboard for the next spike later in 2025.

Potential Path of the Altcoin Market?Trading Family,
To say that our altcoin market has been disappointing would be the understatement of the year. While there definitely have been some winners (I have held Solana through the $8 low), the majority have been a large disappointment. In fact, the last I read, only 42 altcoins have outperformed Bitcoin since the bear market bottom was put in. This is an incredible stat to think about and very telling. Altcoin traders have a difficult task in beating the BTC hodl'ers for sure.
However, recently there have been some hidden indications that our altcoin market will soon increase our odds of success.
First of all, Bitcoin's low fees. Low fees on the Bitcoin blockchain is often a hidden health indicator for the coin signaling weak demand. People often see low fees as a positive thing. But what's actually happening here is that there is low demand for transacting on the chain, therefore, in order to increase the demand, transaction fees are forced down.
Weaker demand does seem to correlate with what the BTC dominance chart is showing us.
You can see from the chart that we have a large sell side liquidity block that has formed, indicating large sell side volume in dominance. Additionally, my indicator has flashed a red dot, signaling that it is time for dominance to drop. We also have our RSI and Macd, crossing down. And if we break from that channel, dominance drop momentum should accelerate.
This brings me to our TOTAL3 chart which is all altcoins excluding Ethereum. The chart is showing us that we have reached an extremely critical support trendline. Price is currently bouncing from it. Additionally, there are large volumes of buyers at this point. You can observe this by the VRVP candles and the liquidity blocks indicator. But contrary to BTC.D in which the RSI and Macd were crossing down, TOTAL3 shows our RSI and Macd crossing up! This is bullish for alts.
Finally, it is a great sign to see that our "M" pattern has looked to have completed right at our point of support.
I have drawn a projected pathway from here. In the first part of our next week, we may see a bit more pump. News of the passing continuing resolution here in the U.S. is still trickling out. Monday, as stock traders jump back in, I would imagine we see more pump as traders feel good about the averted gov't shutdown. This may trickle into Tuesday. But then Wed. is the Fed's day. We are expecting further pause to interest rate. Everyone will be listening to the Fed speak and parsing every syllable that is uttered from J. Pow's tongue. What is says and the bias that is interpreted will be key. I am expecting mostly a non-event here. Which means that bullish bias may wane once again. Crypto, mostly altcoins, really only pump on good news. But negative and even neutral news is a sell to sideways event. Thus, I expect we may hit another local top around Wed. afternoon at which point the altcoin market starts to sell a bit again OR it simply continues sideways again for a few more weeks. Sooner or later though, I believe we are headed towards that 1.3 trillion resistance. It is worthwhile considering to stay in a holding pattern unless we drop below our all-important support. Watch this line closely and draw it on your charts. It will be key!
✌️Stew

Total 3 market Cap AnalysisAs of March 14, 2025, the TOTAL 3 index, which measures the total market capitalization of altcoins excluding Bitcoin and Ethereum, is navigating a critical phase within an ascending channel. This pattern, defined by a rising trend line, has supported the market since October 2023, with a notable spike in early 2024 reinforcing its trajectory. Recently, TOTAL 3 dipped to $717 billion, bouncing off the lower trend line—a key support that has held firm over the past 17 months. The market cap has since recovered to $750 billion, where it’s currently consolidating, potentially for a few months, as altcoins build momentum for the next move.
Looking upward, the upper boundary of the ascending channel points to a bullish target of $1.3 trillion. This level, nearly double the current market cap, aligns with the pattern’s historical slope and could be reached later in 2025, driven by strong fundamentals, seasonal trends, or a surge in altcoin adoption. However, a break below the ascending uptrend line introduces a bearish scenario. Should TOTAL 3 breach and sustain below this support—currently near $717 billion—it could test a lower level at $513 billion. This downside target reflects a significant retracement, possibly to prior support zones from mid-2023 or a 30-40% drop from the recent low, consistent with historical altcoin volatility.
For now, the $750 billion consolidation acts as a pivotal range. A hold above the trend line keeps the $1.3 trillion upside in play, while a confirmed break below shifts focus to $513 billion. Traders should watch volume and momentum indicators for clues on the next direction.

Cmon!!!Cmon!! Give me a break out!!!
Primed for reversal, even on larger time frames. Just wait for the break out and we shall see accumulation phase kick in.

My Final Idea on Total 3 based on wyckoff method !we're in Accumulation phase right now and we have to wait for price to make a clear direction above the resistance line
Leaving this zone means we're ready for good moves and changing the market direction
in other hand we have to wait for USDT.D and BTC.D Move to lower prices
2025 is gonna be the best year for crypto market Be sure about that !

total3 altcoins #Altcoins mcap TOTAL3 handle cup formation neckline region will inevitably pump after successful retest!

TOTAL3 UPDATE (2025 --forecast 2027-2028)TOTAL3 is now in a moment where it could bottom again
It may consolidate at this levels for some time (summer 2025)
or it may reverse from here to the upside (with majors ups and downs ;see open interest)
However this is also a critical level for the AltCoins Space
What we experienced in the last week or so - was mostly the market trying to liquidate
the retail risk appetite sector for leveraged gains
This could be a good entry even for big and smart institutional money into this asset class
If they can relate to the scenario of Money being Rotated into High Risk assets from
the other traditional markets (as they reached the top) and Provide a Liquidity Boost
for the AltCoins sector - also from other types of hedging assets like Risk Off Gold and even BTC
into Risk On like :Altcoins. (Risk-on-risk-off is an investment behavior) 🍀


Last weeks of accumulation before Alt RallyHi There,
I believe we are in the final stage of accumulation. I'm fully allocated to the altcoins right now. We may have already found the bottom in crypto in general or we may experience one last dip soon. In both ways, we'll see a very strong move to the upside which will take like 3-5 months. Note that we may see only BTC rally for couple of weeks before alt rally starts. The worst for now would be spending 2-3 months in the current price range and then move up. I do not believe we've found the top in crypto and follow a long bear market from now. No! For me, the trend is still up for BTC and then rally in altcoins by the second half of 2025.
Long story short I'm still very optimistic. I'm a long term investor so I'll wait for the big move up. Nobody said it's easy.
These are just my opinions and not financial advise.
Do your own research.
Cheers'

Market looks ready for expansionBig cup, and handle formula if it plays out, these are our targets.
BUY THE FEAR!!


TOTAL3 : cup and handle patternif cup and handle pattern is confirmed by the end of September 2025... possibly btc dominance drops and small crypto pumps

Are altcoins ready to take off ? Hello Traders! 🐺
You might have noticed that I haven't posted in a while—so, why the silence?
Over the past two weeks, we've seen massive market manipulation by whales and major players. In times like these, it's often safer to step back, observe, and let the charts reveal the market’s true direction before making any moves.
But now, I genuinely believe the dump is over. Looking at the BTC.D chart, it's currently forming a bearish pattern right at a key resistance level. That alone is enough for me to say: I'm bearish on BTC.D —and by extension, bullish on altcoins !
Why? Because a rising wedge on the weekly BTC.D chart is a strong signal of a bear trap, suggesting money could soon start flowing into altcoins.
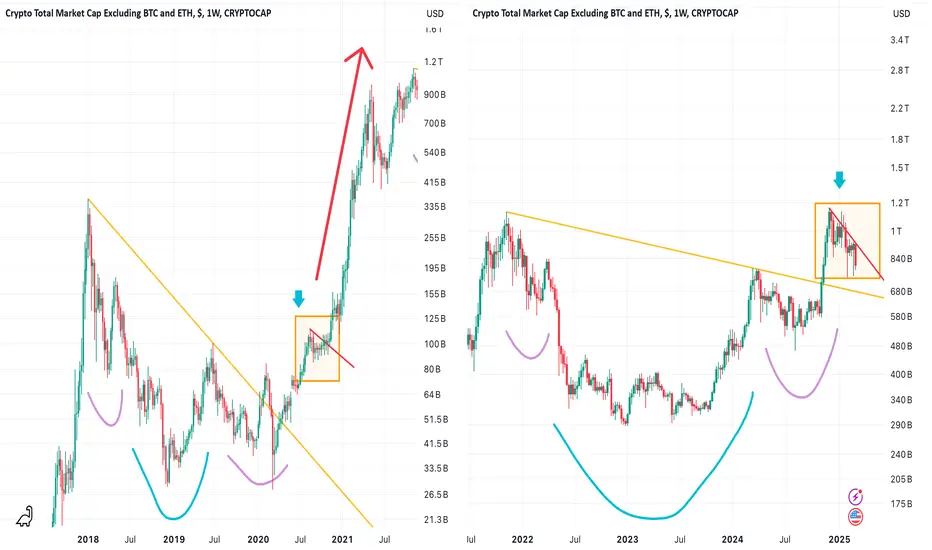
Additionally, in the TOTAL3 chart (which excludes BTC & ETH), we see a massive cup and handle pattern on the weekly timeframe. The price has already broken the neckline and is now accumulating above the support line, potentially gearing up to break past its all-time high and push toward a $3 trillion market cap —which, in my opinion, is a conservative target.
I hope you find this idea valuable! Don’t forget to like and follow for more insights. Your support means the world! 🚀
🐺 KIU_COIN 🐺

Flag patternI don't know about you, but I can't believe that after all this time of decline for altcoins, they will continue to decline... Even in terms of time, we have to climb, I don't know how, but soon the money will come into this season... Unlike most analysts, I am more hopeful for the continuation of the path.

based on the history! this is my market cap and dates it's not a financial advice! do your own due diligence
based on the last alts-season we had1- 1000 days between the bottom and the top
2- we gained around 20x the market cap
my scenario: suppose this season of 2025 we get a big pump specially with the countries, intuitions & banks interest into crypto more and more every year,
if we ever encountered same days range and HALF of the previous pump (which is 10x instead of 20x from the bottom)
result:
A: Oct2025 we will be approaching 3.5 T market cap
B: more conservative result is 5x by October 2025
which makes the top 1.8-1.9T market cap (which is double the previous alt-season market cap)
In both scenarios i don't mean your token you are holding will 5x or 10x, some coins will outperform and reach 20x even in this year.

White House Crypto Summit 2025Today on March 7th the White House will host a Crypto summit for the first time. This summit is expected to host
many prominent figures in the space, here are some of the main ones:
Michael Saylor Founder of Strategy.
● David Bailey CEO of Bitcoin Magazine.
● Matt Huang Co-founder of Paradigm.
● Zack Witkoff Co-founder of world liberty financial
● SEC Chairman Paul Atkins
● Changpeng Zhao (CZ) Co-founder of Binance.
● Kyle Samani Managing partner at Multicoin Capital.
● Anatoly Yakovenko Co-founder of Solana.
● Charles Hoskinson Co-founder of Cardano.
● Sergey Nazarov Co-founder of Chainlink.
● Brian Armstrong CEO of Coinbase.
● Vlad Tenev CEO of Robinhood.
● Arjun Sethi CEO of Kraken.
● Kris Marszalek CEO of Crypto(.)com.
● Brad Garlinghouse CEO of Ripple.
Trump is expected to sign executive orders at 3PM EST during the summit but what these orders are is not confirmed as of yet. I would speculate the "Strategic Reserve" including BTC,ETH,SOL,XRP & ADA would be an EO in some capacity as all of the founders/CEOs of those projects are in attendance. Perhaps regulatory framework, a tariff based system to reward US based crypto projects? In truth the specifics are unpredictable.
What we do know is that each of the major announcements have been sell the news events, as the saying goes "Buy the rumor, sell the news" and that has been true so far. Will this be a repeat? This summit so far has not had a rally going into this event, the charts show that BTC and the broader market have pulled back and retested last years chop range high after a liquidity sweep of previous ATH. Altcoins fairing worse than Bitcoin but structurally very similar. I do think the bearish structure of the HTF chart has many worried, sentiment is very low and many see the sell off continue. Either this is a genius way to acquire cheaper coins for the upcoming reserve or many will be caught offside or sidelined.
For now I am not taking sides, there is no clear read on this event for me but I can guarantee huge volatility on the low time frames, whether this leads to a meaningful move on the high time frames is yet to be seen.

Total3I think you should hold your altcoins, in 2 months you will be rich… We will all see the biggest altcoin season in crypto history… Exactly where everyone is disappointed…. If you remember in 2021 when Bitcoin reached $30,000 no one thought the market would come back and coins would grow again. I think the growth of altcoins is very strong… I think anyone who sells in this rally and growth will regret it

[UPDATE ALT3] Scenario i'm watching (optimistic)Let's navigate through the positive scenario of alt3.

Accumulate crypto nowHere's a 6 chart split of BTC, ETH, SOL, XRP, ADA and TOTAL3. It's a good time to go long DCA accumulate crypto while it's at support levels this week.
3 month high / low:
BTC
high = 109,358
low = 78,168
ETH
high = 4109
low = 2002
SOL
high = 295
low = 125
XRP
high = 3.40
low = 1.28
ADA
high = 1.33
low = .56
TOTAL3
high = 1.16T
low = 743B

Potential Pattern for Altseason 20252020 Altcoin Season Bull Run:
Large Head & Shoulders Bottom ➡︎ Pullback ➡︎ Breakout of Downtrend Line → Massive Pump
Current Situation:
Large Head & Shoulders Bottom ➡︎ Pullback ➡︎ ❓
Do you still believe in the bull market?
Leave a comment!
🔴 Read my signature & publications for more info you don’t want to miss.
🔥 for more future "guesses" like this!

Are alts ready to take off? Let me know what you think?
Could we see incredible highs on the total3 chart?
