DeFi’s Make-or-Break MomentThe spotlight today is on TOTALDEFI, an index that could become one of the most exciting charts in the crypto market.
While many altcoins look heavy under selling pressure, TOTALDEFI is holding firmly at the 61.8% Fibonacci support near 116B. This zone is often a turning point where strong reversals begin. If the level continues to hold, we might see a 20% move to the upside, signaling renewed strength in the DeFi sector.
This price action could be a sign that decentralized finance projects are ready to lead the next market phase.
TOTALDEFI trade ideas

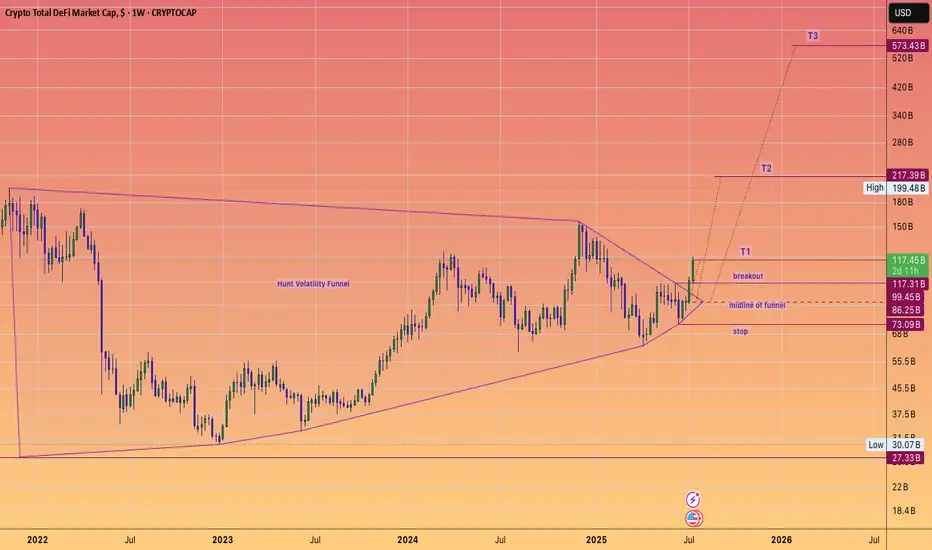
DeFi Moonshot! Moon mission to $573 Billion dollars!DEFI fuelled by Ethereum, built on proven protocols and stablecoin legislation is ready to keep cranking higher for the rest of the year. And instead of a Defi summer of emergence (2020), a multi season of adoption that takes it to half a trillion dollars, hitting these targets of a #HVF
@TheCryptoSniper
The components set to benefit are:
Uniswap #UNI ~ $12.3 Billion
Lido DAO #LDO ~ $9.1 Billion
Aave #AAVE ~ $7.5 Billion
MakerDAO #MKR ~ $4.6 Billion
GMX #GMX ~ $2.5 Billion
Curve #CRV ~ $1.9 Billion
Synthetix #SNX ~ $1.1 Billion
Pulsex #PLSX ~ $0.46 Billion
Key points:
The #TotalDefi index is currently at $117B aligning closely with the $123.6B of TVL
As we see hundreds of billions of dollars get digitized watch this index climb onwards and upwards... With $1 Trillion dollars and obvious milestone that is surely set to be met ... one day.
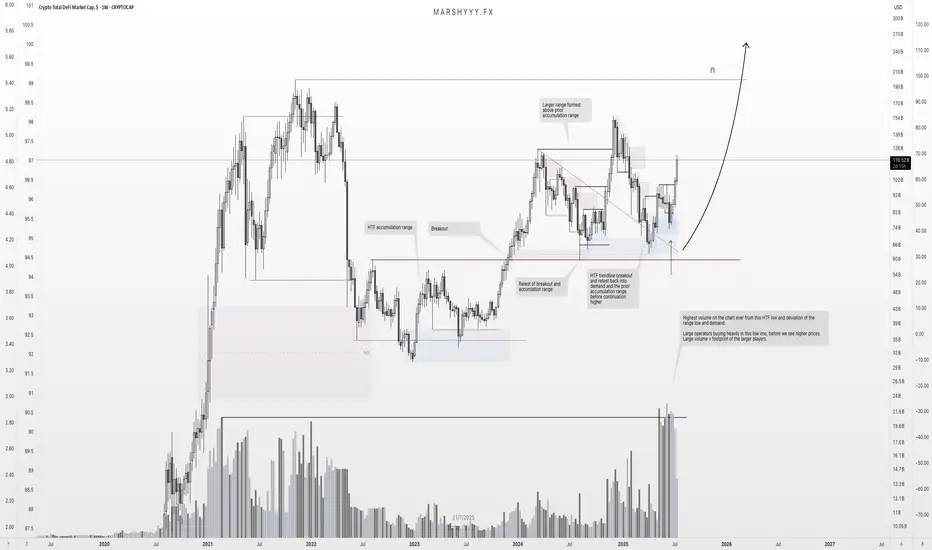
TOTAL DEFI: HTF Reaccumulation Underway — $200B+ In SightThis is one of the cleanest HTF setups in the market right now — and it’s flying under the radar.
We're looking at TOTAL DEFI market cap, and it’s showing all the signs of strong reaccumulation following a textbook breakout–retest structure off a larger HTF accumulation base.
Price broke out from the 2023–2024 accumulation range, retested that breakout zone and range highs in August 2024, swept liquidity, and tapped into unmitigated demand within the accumulation range — before climbing back to the $155B region, creating a larger range above the prior accumulation range it broke out from.
Since then, price pulled all the way back to range lows and HTF demand at $65B, forming a new bullish reversal from this key region and retesting the trendline breakout before continuing another leg higher — as we’re now seeing unfold.
But here’s the key:
🧠 That recent deviation came with the highest volume ever recorded on this chart — right off the range low and HTF demand.
That’s not retail. That’s large operators loading up, leaving their footprint ahead of the next expansion leg.
We’ve now:
- Broken the descending trendline cleanly
- Flipped key SR levels back into support
- Started pushing higher with strong HTF closes
📈 Expectation:
This is a spring + test setup within a reaccumulation range. I’m targeting continuation toward the range highs, followed by a macro breakout that could take DeFi market cap to $200B+ — especially once the prior distribution zone is reclaimed.
This aligns with the broader cycle narrative — liquidity rotating back into altcoins, particularly DeFi, as stablecoin dominance declines and the market shifts fully risk-on into the final phase of the bull cycle.
Key Structure Summary:
- HTF accumulation base → breakout → retest → demand sweep
- Largest volume spike = operator footprint
- Higher lows forming = market structure flipping
- Expecting expansion to $200B+ as trend continues
One to watch closely.
Don’t fade the volume. Don’t fade the structure.
$TOTALDEFI | #1W breakout watchDeFi market cap is once again testing a key support zone — the same level that kickstarted accumulation and a rally in 2023.
🔍 Structure:
— Price is retesting the 1W S/R zone
— Attempting a breakout from the 2024 downtrend line
— Falling wedge pattern forming with a potential reversal setup
📌 Plan of action:
1️⃣ Look for a break above resistance (~$80B)
2️⃣ Wait for a clean retest and confirmation of support
3️⃣ Long entry on confirmation, targeting a move toward $110B+
🛑 Invalidation: Weekly close below $65B would cancel the bullish structure.
🚨 A confirmed breakout here could be the spark for a sector-wide DeFi rally. Monitor for confluence from other alt sectors and indexes.

A wave up for TOTAL DeFi?DeFi found support at the 1:1 pocket as discussed in my recent TOTALDEFI publish.
A wave up could be expected from here, and if this is the case, there are a few resistance zones I have in mind.
Accumulation Resistance: Price could struggle to break out of this resistance structure.
GW Resistance Structure: If price breaks through the previous accumulation area, we have a 0:0.618 resistance window.
200 MA: Slightly beyond GW structure we have the 200 MA.
Demand Line: We also have the demand lIne resistance.
Overall - I am favoring the outcome of finding resistance at the 200 MA, as this has proven to be significant resistance once we go under.
TOTALDEFI could very well be warming up here. I will make a publish later that could strengthen those odds; regarding GOLD and its effects on TOTAL.
Good Luck Traders.
-Not Financial Advice-

Is DeFi on for the 1:1CRYPTOCAP:TOTALDEFI
The entire market is experiencing the third wave of 3 wave corrections.
DiFi has already passed up the 1:0.618 3 wave retracement zone. The next stop is the 1:1.
This correction is going to be a nasty one.
-Not Financial Advice-

The BIGGER PictureCRYPTOCAP:TOTAL CRYPTOCAP:TOTALDEFI CRYPTOCAP:TOTAL2 CRYPTOCAP:TOTAL3 CRYPTOCAP:OTHERS
When backing away from the magnifying glass for a little bit, it all seems to make more sense.
Let’s start with the first 3 wave correction that started in January 2018 and ended December 2018.
There was a huge BC (Buying Climax) followed by a SC (Selling Climax). Then afterwards an AR (Automatic Rally). Then to end with an accumulative ST (Secondary Test); Which in a larger time frame turned out to be a gigantic 1:1.13 - 3 wave correction before continuation.
Later on in June 2019 marked the beginning of another 3 wave correction. This correction was just shy of a 1:1.618 correction (which is a rather large correction (Covid 19 Black Swan Event)). After completion, that's when the fun REALLY started.
May 2021 marked the end of the BC (the beginning of the next 3 wave correction). What was unique about this distribution area is that it retraced down to form an AR; which at the time, I would imagine that very few saw it coming). What followed after the rally down was the UTAD (Up Thrust After Distribution). That distribution phase lasted from October 2021 all the way through to March 2022. Then came the nasty SC followed by a ST to mark the bottom of the bear market. The most unique part of this TA is that this was another huge 1:1.618 3 wave correction.
SO, similar to the 3 wave correction that formed at the previous LPS in 2020, we are currently experiencing the same situation ( a 1:0.618 correction) ; closing in on the LPS event of this accumulation phase. And the clue is in the large bottom wick (Green Arrow) that shot through the 1:0.786 last month.
According to this TA, we are in the moment that offers the deepest value buys before the real BC begins.
With that being noted; Window shopping is close to over; so get your assets in order because we are closing in on the moment we have all been waiting for.
Good Luck Traders!
- Not Financial Advice -

Total DEFI to $300B? I believe that in the near future, the total DeFi market cap could reach $300 billion. 📈
✅ Key factors driving this growth:
• The rise of LSDs (Liquid Staking Derivatives) and real yield in DeFi
• Increasing institutional interest in DeFi solutions
• Growing liquidity as L2s integrate deeper with major blockchains
• Expansion of RWA (Real-World Assets) and tokenization
The chart shows a strong setup: the local support level is holding, and the upside potential is significantly greater than the downside risk.
❓ What do you think? Will we see TOTAL DEFI at $300B by the end of 2025?
#DeFi #Crypto #TotalValueLocked #CryptoMarket 🚀

#DeFi #Market #Cap #DeFi #Market #Cap
Strong breakout of the Bullish Flag re-accumulation which happened above the strong support confluence of the Key Zone + EMAs Cluster (ema 50, ema 100, ema 200)🔥
Looking for AMEX:DEFI sector to skyrocket since now🚀
Don't you forget to grab defi coins on this rally?😏

This is Crypto Total Delfi Market Cap now
This is Crypto Total Delfi Market Cap now
Following hitting $125B on 12th March this year, it has dropped to roughly $70.4B.
This is clear that cash inflow has dropped significantly

We are very earlyTotaldefi is acting like it did in 2020. The breakout to 200 billion is step one which can come much faster than anyone is currently anticipating and well before BTC makes a new attack on an its cycle high. You’ll have to zoom in on 2020 to see what I see but it’s there between August and October before it took off that best represents where we are now and what comes afterward. This cycle, expect AAVE like performance from smaller cap tokens in the rwa space. I don’t expect the big lending protocols to do the same thing they did then but rather 5x to 10x tops. The 100x gains will be smaller more nimble and simpler rwa protocols with better tokenomics and much less development overhead.

DeFi Aiming to the TOPDeFi may be done with its long break as it aims toward the top with strong momentum and the Gaussian channel showing that it is making a U turn. Big pumps may be ahead of us this month if we can hold above the .618. CRYPTOCAP:TOTALDEFI

TOTALDEFI Bullish OutlookCRYPTOCAP:TOTALDEFI
TOTALDEFI inverted head & shoulder spotted, broke the neckline 2 weeks before this post, my target is around 150B.
Let's watch some defi projects closely, BSE:SUPER and OTC:GHST is already skyrocketing.

TOTAL DEFI MARKETCAP LONG-TERM TOTAL DEFI MARKETCAP LONG-TERM
parallel channels within parallel channels :D
2024 is a candidate to be the year of defi again.
Best DE-FI projects:
AAVE/USD
MAKER/USD
COMP/USD
UNISWAP/USD

TOTAL DEFI Weekly bull chart This chart shows a clear breakout of a big resistance level, this also shows the trajectory which we arer likely on and the next level that we will hit

Bull markets start with DeFiLet's look back at the previous bull market. As you can see, with the explosive growth of DeFi, the bull market officially started.
The upcoming bull market can be the same. We expect to see massive adoption of retail and commercial investors this time.
What is your DeFi bet? Will you play it safe or high R:R? Let me know below!

$TOTALDEFI Identifying a Rectangle Bottom PatternHello, Traders! Today, I want to share an exciting technical analysis finding on the cryptocurrency Total DeFi ( CRYPTOCAP:TOTALDEFI ). A rectangle bottom pattern has been identified, indicating the potential for a bullish move in the near future. Let's delve into the details!
📈 Ticker: CRYPTOCAP:TOTALDEFI
📅 Timeframe: Daily Chart
📊 Pattern: Rectangle Bottom
📉 Understanding the Rectangle Bottom Pattern:
A rectangle bottom is a bullish chart pattern characterized by a horizontal price consolidation range. It signifies a period of consolidation before a potential bullish breakout. This pattern indicates the possibility of an upward price movement.
🔍 Identifying the Rectangle Bottom on CRYPTOCAP:TOTALDEFI :
Upon analyzing the daily chart of CRYPTOCAP:TOTALDEFI , the following observations come to light:
1️⃣ Price consolidation range: CRYPTOCAP:TOTALDEFI has been trading within a horizontal range, with relatively equal highs and lows.
2️⃣ Multiple touches: The price has tested the upper and lower boundaries of the range multiple times, confirming the validity of the pattern.
3️⃣ Volume analysis: Observe increasing trading volume during the breakout phase to confirm the pattern's reliability.
📈 Price Targets and Trading Strategy:
If the rectangle bottom pattern on CRYPTOCAP:TOTALDEFI plays out as anticipated, a potential bullish breakout above the upper boundary may occur, indicating a potential price appreciation. Consider the following price targets:
1️⃣ Target 1: Resistance level near $60 billion
2️⃣ Target 2: Psychological resistance near $80 billion
🛡️ Risk Management:
Managing risk is crucial for successful trading. Implement the following risk management techniques:
1️⃣ Set a stop-loss order below the lower boundary to protect against unexpected price reversals.
2️⃣ Adjust position size based on your risk tolerance and overall portfolio management strategy.
🔔 Conclusion:
Keep a close eye on Total DeFi ( CRYPTOCAP:TOTALDEFI ) as it continues to develop this rectangle bottom pattern. The pattern suggests the potential for a bullish breakout and subsequent price increase. However, please remember that technical analysis is not foolproof, and market conditions can change. Consider incorporating additional analysis and fundamental factors before making any trading decisions.
Disclaimer: This post is for informational purposes only and should not be considered as financial advice. Always conduct your own research and consult with a qualified financial professional before making any investment decisions.
Happy Trading! 📈💰
#tradingview #technicalanalysis #rectanglebottom #bullishpotential #TOTALDEFI #cryptocurrency #chartpatterns #tradingstrategies #investing #finance #marketanalysis


DefiTotal rocketDefiTota have same pattern with MCTOTAL inverse head and shoulders.
Most Defi projects have not yet started to pump hard. The walls on the exchanges are just ridiculous and very thin. We are waiting for a great pump of all CEX soon.

For the first time in months TOTAL is ABOVE TOTAL3Total is the total crypto market cap. Total3 is total market cap minus BTC and ETH or Total3 is ALT coin market DeFi and anything not ETH or BTC. For the first time in months the whole market capp is stronger or seeing more action then ALTs. Is the time for bleeding at an end? it seems we are getting close to something anything different then a BEAR MARKET.
What do you all think please comment below

Defi season coming?!Here is the idea that after breaking out of the trend line and retracing back to it we can head toward depicted areas on the chart which can translate to a Defi party or season is possible to happen.lets see how it plays out.always a student!
