The Bull Case For TRACThis is one is my unicorn. TRAC Network upgrade on the horizon. Let's see if miracles can happen. That's the path. The path to a new ATH and price discovery. I hope you brought your A game Benny.
Related pairs
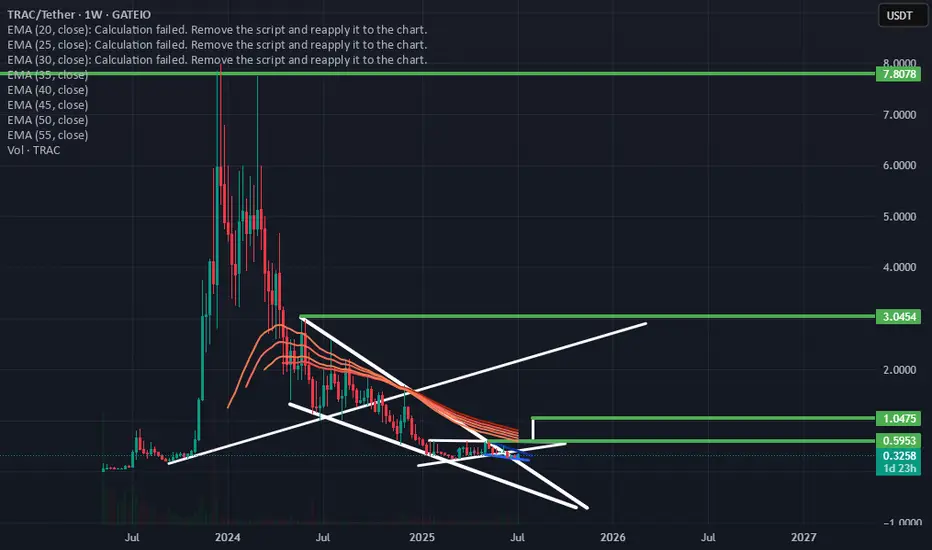
$TRAC @trac_btc #Ordinals — Beginning of a Wyckoff AccumulationPOLONIEX:TRACUSDT @trac_btc #Ordinals 👀
— Possibly the beginning of a Wyckoff Accumulation Range—Schematic #1 or #2 are my base case for now.
If the local range POC holds as the LPS (Last Point of Support), then Schematic #2 is in play. If it’s lost, the probability shifts toward a new low and

Get Some...TRAC 2.0 is coming and TRAC will be the network asset. Utilizing the USDT funded @Holepunch_techstack. Headless crytpto network is coming live in Q1. $10,000,000 MCAP. This thing has 20-40X written all over it.

TRAC 2.0 Is ComingTRAC 2.0 is coming and TRAC will be the network asset. Utilizing the USDT funded @Holepunch_techstack. Headless crytpto network is coming live in Q1. $10,000,000 MCAP. This thing has 20-40X written all over it.
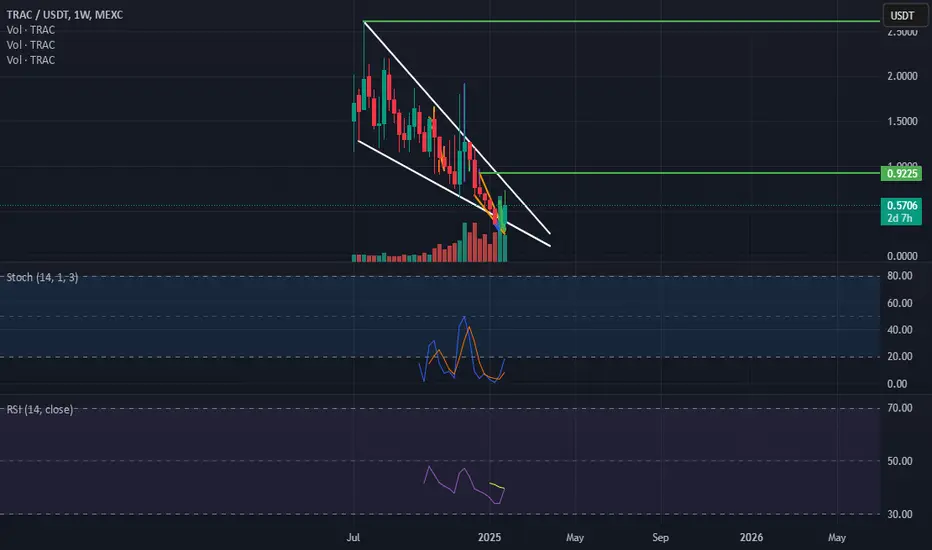
An Interesting Low Liquidity FractalAn interesting low liquidity fractal on MEXC. Let's see what plays out.

Let's Talk About This ChartSo, this one has tested patience, undoubtedly. There has been delay, after delay, after delay. All that being said, let's look at some potential clues in the charts. On the weekly, we are closing in on (likely today) another stoch. RSI bottom. On the daily, the Bollinger bands are pursed hardcore an

Swing//@version=5
indicator("RSI 14 Golden Cross with Volume Break MA 20", overlay=true)
// Input parameters
rsi_length = input.int(14, title="RSI Length")
ma_volume_length = input.int(20, title="MA Volume Length")
// Get weekly data
weekly_rsi = request.security(syminfo.tickerid, "W", ta.rsi(close, rs

Bout To Rip!!!Massive, potential, falling wedge on the daily. Bullish bottom and crossup on the Stoch. RSI, weekly. If that don't light your fire your wood's wet.

Potential 30X Profits for a very undervalued Project!One of the big projects in the ordinals world!
30x will put the market around 1.2 B which is realistically possible considering the uptrend structure for the whole Market.
Yet we can drop fast to 0.80-0.90 however its gonna be the best area to add to your position.
below .80 trade is invalid.
high r

Is #TRAC on Track for higher prices? LSE:TRAC currently at $2.2, All time high 7.9
#trac future Price speculation $12

See all ideas
Summarizing what the indicators are suggesting.
Oscillators
Neutral
SellBuy
Strong sellStrong buy
Strong sellSellNeutralBuyStrong buy
Oscillators
Neutral
SellBuy
Strong sellStrong buy
Strong sellSellNeutralBuyStrong buy
Summary
Neutral
SellBuy
Strong sellStrong buy
Strong sellSellNeutralBuyStrong buy
Summary
Neutral
SellBuy
Strong sellStrong buy
Strong sellSellNeutralBuyStrong buy
Summary
Neutral
SellBuy
Strong sellStrong buy
Strong sellSellNeutralBuyStrong buy
Moving Averages
Neutral
SellBuy
Strong sellStrong buy
Strong sellSellNeutralBuyStrong buy
Moving Averages
Neutral
SellBuy
Strong sellStrong buy
Strong sellSellNeutralBuyStrong buy
Displays a symbol's price movements over previous years to identify recurring trends.
Frequently Asked Questions
The current price of TRAC/Tether (TRAC) is 0.3430 USDT — it has fallen −3.03% in the past 24 hours. Try placing this info into the context by checking out what coins are also gaining and losing at the moment and seeing TRAC price chart.
TRAC/Tether price has risen by 29.34% over the last week, its month performance shows a −13.73% decrease, and as for the last year, TRAC/Tether has decreased by −78.85%. See more dynamics on TRAC price chart.
Keep track of coins' changes with our Crypto Coins Heatmap.
Keep track of coins' changes with our Crypto Coins Heatmap.
TRAC/Tether (TRAC) reached its highest price on Dec 19, 2023 — it amounted to 7.9880 USDT. Find more insights on the TRAC price chart.
See the list of crypto gainers and choose what best fits your strategy.
See the list of crypto gainers and choose what best fits your strategy.
TRAC/Tether (TRAC) reached the lowest price of 0.0136 USDT on May 12, 2023. View more TRAC/Tether dynamics on the price chart.
See the list of crypto losers to find unexpected opportunities.
See the list of crypto losers to find unexpected opportunities.
The safest choice when buying TRAC is to go to a well-known crypto exchange. Some of the popular names are Binance, Coinbase, Kraken. But you'll have to find a reliable broker and create an account first. You can trade TRAC right from TradingView charts — just choose a broker and connect to your account.
Crypto markets are famous for their volatility, so one should study all the available stats before adding crypto assets to their portfolio. Very often it's technical analysis that comes in handy. We prepared technical ratings for TRAC/Tether (TRAC): today its technical analysis shows the neutral signal, and according to the 1 week rating TRAC shows the sell signal. And you'd better dig deeper and study 1 month rating too — it's sell. Find inspiration in TRAC/Tether trading ideas and keep track of what's moving crypto markets with our crypto news feed.
TRAC/Tether (TRAC) is just as reliable as any other crypto asset — this corner of the world market is highly volatile. Today, for instance, TRAC/Tether is estimated as 4.37% volatile. The only thing it means is that you must prepare and examine all available information before making a decision. And if you're not sure about TRAC/Tether, you can find more inspiration in our curated watchlists.
You can discuss TRAC/Tether (TRAC) with other users in our public chats, Minds or in the comments to Ideas.