DAX: Strong Growth Ahead! Long!
My dear friends,
Today we will analyse DAX together☺️
The price is near a wide key level
and the pair is approaching a significant decision level of 24,119.04. Therefore, a strong bearish reaction here could determine the next move down.We will watch for a confirmation candle, and then target the next key level of 24,214.64.Recommend Stop-loss is beyond the current level.
❤️Sending you lots of Love and Hugs❤️
DE40 trade ideas

DAX H4 | Falling toward an overlap supportThe DAX (GER30) is falling towards an overlap support and could potentially bounce off this level to climb higher.
Buy entry is at 23,447.57 which is an overlap support.
Stop loss is at 22,700.00 which is a level that lies underneath an overlap support and the 23.6% Fibonacci retracement.
Take profit is at 24,732.86 which is a resistance that aligns with the 127.2% Fibonacci extension.
High Risk Investment Warning
Trading Forex/CFDs on margin carries a high level of risk and may not be suitable for all investors. Leverage can work against you.
Stratos Markets Limited (tradu.com/uk):
CFDs are complex instruments and come with a high risk of losing money rapidly due to leverage. 63% of retail investor accounts lose money when trading CFDs with this provider. You should consider whether you understand how CFDs work and whether you can afford to take the high risk of losing your money.
Stratos Europe Ltd (tradu.com/eu):
CFDs are complex instruments and come with a high risk of losing money rapidly due to leverage. 63% of retail investor accounts lose money when trading CFDs with this provider. You should consider whether you understand how CFDs work and whether you can afford to take the high risk of losing your money.
Stratos Global LLC (tradu.com/en):
Losses can exceed deposits.
Please be advised that the information presented on TradingView is provided to Tradu (‘Company’, ‘we’) by a third-party provider (‘TFA Global Pte Ltd’). Please be reminded that you are solely responsible for the trading decisions on your account. There is a very high degree of risk involved in trading. Any information and/or content is intended entirely for research, educational and informational purposes only and does not constitute investment or consultation advice or investment strategy. The information is not tailored to the investment needs of any specific person and therefore does not involve a consideration of any of the investment objectives, financial situation or needs of any viewer that may receive it. Kindly also note that past performance is not a reliable indicator of future results. Actual results may differ materially from those anticipated in forward-looking or past performance statements. We assume no liability as to the accuracy or completeness of any of the information and/or content provided herein and the Company cannot be held responsible for any omission, mistake nor for any loss or damage including without limitation to any loss of profit which may arise from reliance on any information supplied by TFA Global Pte Ltd.
The speaker(s) is neither an employee, agent nor representative of Tradu and is therefore acting independently. The opinions given are their own, constitute general market commentary, and do not constitute the opinion or advice of Tradu or any form of personal or investment advice. Tradu neither endorses nor guarantees offerings of third-party speakers, nor is Tradu responsible for the content, veracity or opinions of third-party speakers, presenters or participants.

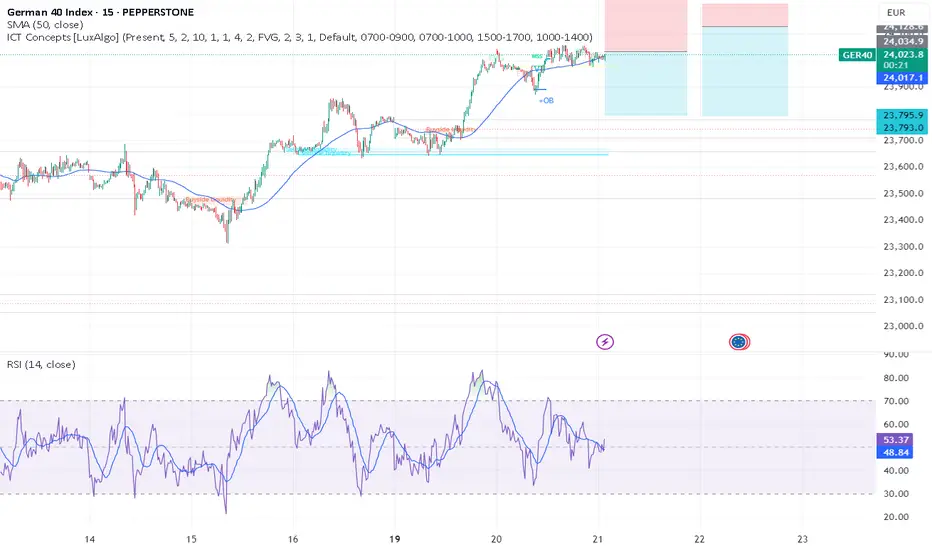
DAX/GER - setting up a perfect SHORTTeam, please carefully review the chart.
We have a soft short position at this market price of 24037-24056
However, I would love to ADD extra volume at 23135-23155
Our first target at 23950-23925
NOTE: once it reaches the target - take 30-50% volume partial and bring stop loss to BE
Our second target is 23865-23825
Please follow the instructions carefully.
DAX INTRADAY sideways consolidation brekoutThe DAX index remains in a long-term uptrend, reflecting a bullish overall sentiment. The recent price action shows a bullish breakout above sideways consolidation.
The key support level is at 23,520, which marks the lower boundary of the recent trading range. If the index pulls back and holds above this level, it would suggest continued bullish momentum. A rebound from 23,520 could see the DAX pushing toward resistance levels at 23,990, then 24,200, and potentially 24,450 in the longer term.
On the downside, a confirmed break and daily close below 23,520 would weaken the bullish case. This would open the door for further declines, with the next support at 23,300, followed by a deeper retracement toward 23,060.
Conclusion:
The DAX outlook remains bullish while holding above 23,520. A bounce from this level supports a move higher, but a break below it would shift the outlook to bearish in the short term.
This communication is for informational purposes only and should not be viewed as any form of recommendation as to a particular course of action or as investment advice. It is not intended as an offer or solicitation for the purchase or sale of any financial instrument or as an official confirmation of any transaction. Opinions, estimates and assumptions expressed herein are made as of the date of this communication and are subject to change without notice. This communication has been prepared based upon information, including market prices, data and other information, believed to be reliable; however, Trade Nation does not warrant its completeness or accuracy. All market prices and market data contained in or attached to this communication are indicative and subject to change without notice.

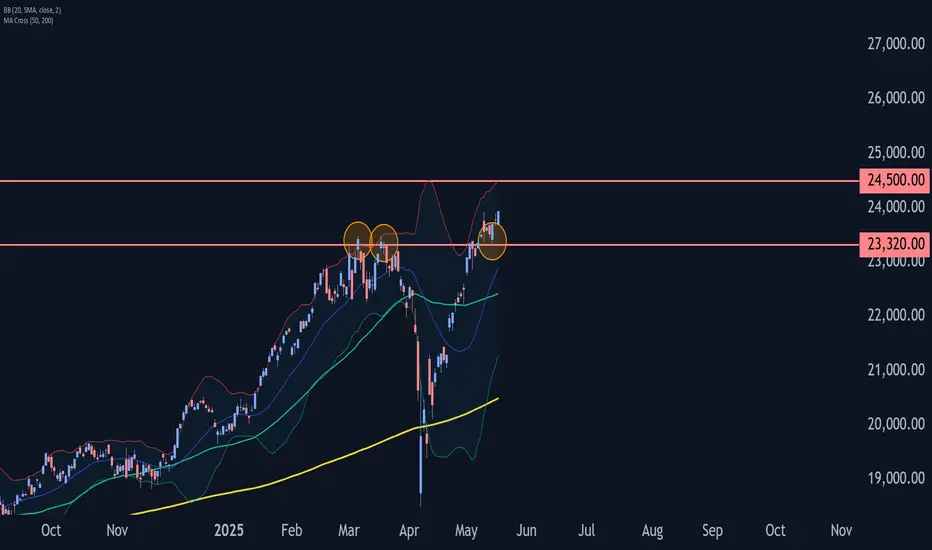
DAX Wave Analysis – 19 May 2025
- DAX reversed from the support level 23320.00
- Likely to rise to resistance level 24500.00
DAX index recently reversed from the key support level 23320.00 (former double top from March, as can be seen from the daily DAX chart below).
The upward reversal from the support level 23320.00 started the active minor impulse wave 5, which then broke above the minor resistance level 23925.00 (which stopped the previous impulse wave 3).
Given a clear daily uptrend, the DAX index can be expected to rise to the next resistance level 24500.00 (which is the target price for the completion of the active impulse wave (3)).
The Burst of the DAX Bubble: What's Next?In the previous scenario, the price bubble of Germany's DAX stock index burst, leading to a sharp drop in the index.
Now, we're anticipating that the second bubble might burst as well.

DAX is holing the rallyA bullish situation is continuing to build on DAX (German index). Unlike US indices, it has renewed the historical high and displays notable strength, as the US dollar pushes down. “Sell America” narrative helps it to consistently climb higher without any pullbacks, forming small consolidations all the way during the rally.
The previous “coil” (a very narrow chart formation) has been lasting for already two weeks, so it’s possible to either observe a correction to the downside or an upside breakout. The latter seems as a more realistic scenario given the improving sentiment for stocks across the board.
Three days of correction below the previous intermediate-term high can point to good timing for a possible long position, and a position below upper band of Bollinger Bands (21) shows yet a potential to continue rising.
Don't forget - this is just the idea, always do your own research and never forget to manage your risk!

Dax Index London Open backtesting sessionBacktesting session on 15min fractal. Dax Index during London Killzone and London Open

DAX Will Keep Growing! Buy!
Hello,Traders!
DAX broke the key horizontal
Level of 23,319 and the index
Made a pullback and retest
And is now going up again
So we are bullish biased
And we will be expecting
A further bullish move up
Buy!
Comment and subscribe to help us grow!
Check out other forecasts below too!
Disclosure: I am part of Trade Nation's Influencer program and receive a monthly fee for using their TradingView charts in my analysis.

German DAX – Bearish Alt-Bat Pattern in Play?FX:GER30
The German DAX remains technically trapped in a defined range, with resistance now under pressure at €23,960 and intraday support printed at €23,358 . Notably, the index continues to reject the idea of reclaiming the weekly fractal resistance from March, forged at €23,478 .
The index is forming a bearish at-bat pattern , with a PRZ projected at €24,075 , corresponding to the 113% Fibonacci extension of the prior XA leg. This extension presents a technically significant reversal point and warrants close observation for price exhaustion.
📉 Bearish Scenario:
We could see a corrective leg targeting the 38.2% Fibonacci retracement at €22,085, which also aligns with prior structural lows. The daily fractal support at €22,306 becomes a critical interim level to watch during this potential pullback.
🔍 Key Levels:
Resistance: €23,960 / €24,075 (alt-Bat PRZ)
Intraday Support: €23,358
Weekly Fractal Resistance (broken): €23,478
Daily Fractal Support: €22,306
Bearish Target (38.2% fib): €22,085
📌 Outlook:
Bias leans bearish while below €24,075. A reaction at the PRZ could provide tactical short opportunities, especially if confirmed by momentum divergence or candlestick rejection signals on lower timeframes. As always, manage risk accordingly.
Happy Trading,
André Cardoso

DAX40 INTRADAY Bullish breakout supported at 23520
The DAX index remains in a long-term uptrend, reflecting a bullish overall sentiment. The recent price action shows a bullish breakout above sideways consolidation.
The key support level is at 23,520, which marks the lower boundary of the recent trading range. If the index pulls back and holds above this level, it would suggest continued bullish momentum. A rebound from 23,520 could see the DAX pushing toward resistance levels at 23,990, then 24,200, and potentially 24,450 in the longer term.
On the downside, a confirmed break and daily close below 23,520 would weaken the bullish case. This would open the door for further declines, with the next support at 23,300, followed by a deeper retracement toward 23,060.
Conclusion:
The DAX outlook remains bullish while holding above 23,520. A bounce from this level supports a move higher, but a break below it would shift the outlook to bearish in the short term.
This communication is for informational purposes only and should not be viewed as any form of recommendation as to a particular course of action or as investment advice. It is not intended as an offer or solicitation for the purchase or sale of any financial instrument or as an official confirmation of any transaction. Opinions, estimates and assumptions expressed herein are made as of the date of this communication and are subject to change without notice. This communication has been prepared based upon information, including market prices, data and other information, believed to be reliable; however, Trade Nation does not warrant its completeness or accuracy. All market prices and market data contained in or attached to this communication are indicative and subject to change without notice.

Bullish momentum to extend?DAX40 (DE40) has bounced off the pivot and could potentially rise to the 1st resistance.
Pivot: 23,438.30
1st Support: 22,533.30
1st Resistance: 24,741.85
Risk Warning:
Trading Forex and CFDs carries a high level of risk to your capital and you should only trade with money you can afford to lose. Trading Forex and CFDs may not be suitable for all investors, so please ensure that you fully understand the risks involved and seek independent advice if necessary.
Disclaimer:
The above opinions given constitute general market commentary, and do not constitute the opinion or advice of IC Markets or any form of personal or investment advice.
Any opinions, news, research, analyses, prices, other information, or links to third-party sites contained on this website are provided on an "as-is" basis, are intended only to be informative, is not an advice nor a recommendation, nor research, or a record of our trading prices, or an offer of, or solicitation for a transaction in any financial instrument and thus should not be treated as such. The information provided does not involve any specific investment objectives, financial situation and needs of any specific person who may receive it. Please be aware, that past performance is not a reliable indicator of future performance and/or results. Past Performance or Forward-looking scenarios based upon the reasonable beliefs of the third-party provider are not a guarantee of future performance. Actual results may differ materially from those anticipated in forward-looking or past performance statements. IC Markets makes no representation or warranty and assumes no liability as to the accuracy or completeness of the information provided, nor any loss arising from any investment based on a recommendation, forecast or any information supplied by any third-party.

DAX WILL KEEP GROWING|LONG|
✅DAX is trading in an uptrend
And the index made a bullish
Breakout of the key horizontal
Level of 23,400 and the breakout
Is confirmed so we are bullish
Biased and we will be expecting
A further bullish move up
LONG🚀
✅Like and subscribe to never miss a new idea!✅
Disclosure: I am part of Trade Nation's Influencer program and receive a monthly fee for using their TradingView charts in my analysis.

Bullish momentum to extend?GER40 has bounced off the support level which is a pullback support and could potentially rise from this level to our take profit.
Entry: 23,511.62
Why we like it:
There is a pullback support level.
Stop loss: 23,150.34
Why we like it:
There is a pullback support level.
Take profit: 24,780.49
Why we like it:
There is a resistance level at the 127.2% Fibonacci extension.
Enjoying your TradingView experience? Review us!
Please be advised that the information presented on TradingView is provided to Vantage (‘Vantage Global Limited’, ‘we’) by a third-party provider (‘Everest Fortune Group’). Please be reminded that you are solely responsible for the trading decisions on your account. There is a very high degree of risk involved in trading. Any information and/or content is intended entirely for research, educational and informational purposes only and does not constitute investment or consultation advice or investment strategy. The information is not tailored to the investment needs of any specific person and therefore does not involve a consideration of any of the investment objectives, financial situation or needs of any viewer that may receive it. Kindly also note that past performance is not a reliable indicator of future results. Actual results may differ materially from those anticipated in forward-looking or past performance statements. We assume no liability as to the accuracy or completeness of any of the information and/or content provided herein and the Company cannot be held responsible for any omission, mistake nor for any loss or damage including without limitation to any loss of profit which may arise from reliance on any information supplied by Everest Fortune Group.

DAX 15.05.2025~+ post US-China trade talks positive sentiment
~+ Latest US ec. data (Claims, Philly Fed, Retail. PPI down)

DAX 12.05.2025~+ post US-China talks, positive sentiment
*DAX didn't hold gains vs US indices on the reaction of the trade talks - should've been more cautious.

Is DAX ready for a slight correction lower?We are watching the German XETR:DAX as it is currently struggling to go for a new all-time high. Can this be the moment for a deeper correction lower?
Let's dig in...
MARKETSCOM:GERMANY40
Let us know what you think in the comments below.
Thank you.
77.3% of retail investor accounts lose money when trading CFDs with this provider. You should consider whether you understand how CFDs work and whether you can afford to take the high risk of losing your money. Past performance is not necessarily indicative of future results. The value of investments may fall as well as rise and the investor may not get back the amount initially invested. This content is not intended for nor applicable to residents of the UK. Cryptocurrency CFDs and spread bets are restricted in the UK for all retail clients.

DAX: Will Go Up! Long!
My dear friends,
Today we will analyse DAX together☺️
The in-trend continuation seems likely as the current long-term trend appears to be strong, and price is holding above a key level of 23,491.05 So a bullish continuation seems plausible, targeting the next high. We should enter on confirmation, and place a stop-loss beyond the recent swing level.
❤️Sending you lots of Love and Hugs❤️

DAX40 INTRADAY uptrend supported at 23300The DAX index remains in a long-term uptrend, reflecting a bullish overall sentiment. However, recent price action shows consolidation, with the index trading sideways after earlier gains.
The key support level is at 23,300, which marks the lower boundary of the recent trading range. If the index pulls back and holds above this level, it would suggest continued bullish momentum. A rebound from 23,300 could see the DAX pushing toward resistance levels at 23,990, then 24,200, and potentially 24,450 in the longer term.
On the downside, a confirmed break and daily close below 23,300 would weaken the bullish case. This would open the door for further declines, with the next support at 23,060, followed by a deeper retracement toward 22,615.
Conclusion:
The DAX outlook remains bullish while holding above 23,300. A bounce from this level supports a move higher, but a break below it would shift the outlook to bearish in the short term.
This communication is for informational purposes only and should not be viewed as any form of recommendation as to a particular course of action or as investment advice. It is not intended as an offer or solicitation for the purchase or sale of any financial instrument or as an official confirmation of any transaction. Opinions, estimates and assumptions expressed herein are made as of the date of this communication and are subject to change without notice. This communication has been prepared based upon information, including market prices, data and other information, believed to be reliable; however, Trade Nation does not warrant its completeness or accuracy. All market prices and market data contained in or attached to this communication are indicative and subject to change without notice.

DAX H4 | Bullish uptrend to extend higher?The DAX (GER30) is trading close to an overlap support and could potentially bounce off this level to climb higher.
Buy entry is at 23,447.57 which is an overlap support.
Stop loss is at 22,700.00 which is a level that lies underneath an overlap support and the 23.6% Fibonacci retracement.
Take profit is at 24,732.86 which is a resistance that aligns with the 127.2% Fibonacci extension.
High Risk Investment Warning
Trading Forex/CFDs on margin carries a high level of risk and may not be suitable for all investors. Leverage can work against you.
Stratos Markets Limited (tradu.com):
CFDs are complex instruments and come with a high risk of losing money rapidly due to leverage. 63% of retail investor accounts lose money when trading CFDs with this provider. You should consider whether you understand how CFDs work and whether you can afford to take the high risk of losing your money.
Stratos Europe Ltd (tradu.com):
CFDs are complex instruments and come with a high risk of losing money rapidly due to leverage. 63% of retail investor accounts lose money when trading CFDs with this provider. You should consider whether you understand how CFDs work and whether you can afford to take the high risk of losing your money.
Stratos Global LLC (tradu.com):
Losses can exceed deposits.
Please be advised that the information presented on TradingView is provided to Tradu (‘Company’, ‘we’) by a third-party provider (‘TFA Global Pte Ltd’). Please be reminded that you are solely responsible for the trading decisions on your account. There is a very high degree of risk involved in trading. Any information and/or content is intended entirely for research, educational and informational purposes only and does not constitute investment or consultation advice or investment strategy. The information is not tailored to the investment needs of any specific person and therefore does not involve a consideration of any of the investment objectives, financial situation or needs of any viewer that may receive it. Kindly also note that past performance is not a reliable indicator of future results. Actual results may differ materially from those anticipated in forward-looking or past performance statements. We assume no liability as to the accuracy or completeness of any of the information and/or content provided herein and the Company cannot be held responsible for any omission, mistake nor for any loss or damage including without limitation to any loss of profit which may arise from reliance on any information supplied by TFA Global Pte Ltd.
The speaker(s) is neither an employee, agent nor representative of Tradu and is therefore acting independently. The opinions given are their own, constitute general market commentary, and do not constitute the opinion or advice of Tradu or any form of personal or investment advice. Tradu neither endorses nor guarantees offerings of third-party speakers, nor is Tradu responsible for the content, veracity or opinions of third-party speakers, presenters or participants.

Technical Weekly AnalysisStart your week by identifying the key price levels and trends.
The SpreadEx Research team has analysed the most popular markets, including stocks, indices, commodities & forex.
--------------------------------------------------------------------------------------------------------------
Analysis
Germany 40 is trending bullish and currently in an impulsive phase, trading at 23,741. It’s comfortably above its VWAP of 22,652, highlighting strong upside pressure. RSI at 70.0 suggests the move may be getting stretched. Support sits at 21,025, with resistance at 24,280.
UK 100 remains in a bullish trend and impulsive phase, with price at 8,580.8 and a VWAP of 8,492. Momentum is stable with RSI at 57.7. Support is noted at 8,259, while resistance is up at 8,724.
Wall Street is now bullish and impulsive, trading at 42,145.6 and well above its VWAP of 39,404. With RSI at 63.3 and price above resistance at 41,340, sentiment remains positive. Initial support is lower at 37,468.
Brent Crude is in a bullish trend and impulsive phase, trading at 6,549.7 above its VWAP of 6,362. RSI at 53.9 reflects moderate buying strength but importantly back over the 50 level. Support lies at 5,892, while resistance is overhead at 6,833.
Gold has entered a correction phase within a broader bullish trend and could be about to see a bearish trend reversal. It trades at 3,218.4, now below its VWAP of 3,317. RSI at 45.5 confirms fading momentum. Support is seen at 3,200 and resistance at 3,426.
EUR/USD is now starting to trend bearish and in an impulsive move lower, trading at 1.1110, below the VWAP of 1.1337. RSI at 39.8 points to negative momentum. Support is at 1.1167, with resistance higher at 1.1510.
GBP/USD is correcting within what is still an overall bullish trend, trading at 1.3184 under its VWAP of 1.3311. RSI at 46.8 reflects fading strength. Support is at 1.3200, and resistance is seen at 1.3426.
USD/JPY has broken back into a bullish trend and impulsive phase, trading at 148.19, well above its VWAP of 143.66. RSI at 63.1 (its highest since Jan) confirms the strong upside momentum. Support is located at 140.22, while resistance is at 147.10.

UPDATE: Text book W Formation for DE40 heading to target 25,113Since the last update, the Germany 40 index has been moving like a champ.
There is no slowing momentum, and it seems like there is more push to come.
We also have further reasons for the rally:
🤝 Easing Global Trade Tensions Boost Investor Confidence
The recent 90-day suspension and significant reduction of tariffs between the U.S. and China have alleviated fears of a prolonged trade war, leading to a global market rally that propelled the DAX to new heights.
🏗️ Germany’s Fiscal Stimulus Spurs Economic Optimism
The German government's increased spending on defense and infrastructure has invigorated domestic industries, contributing to the DAX's upward momentum.
💻 Tech Sector Performance Drives Market Gains
German tech giants, notably SAP, have experienced substantial growth due to strategic shifts towards AI and cloud services, significantly influencing the DAX's performance.
So we can just let this play out until it hits the first target at 25,113.
Disclosure: I am part of Trade Nation's Influencer program and receive a monthly fee for using their TradingView charts in my analysis.

DAX LongDAX is now net long on the regression break.
I am not taking this trade at record high with the tariff conversation going on at this time.
