F40 trade ideas


CAC40 STRONG BULLISH MY eyes and the brains still processing
CAC40 is in strong Bullish market
Besides the depth from Feb on Corona spread


FR40EUR_ Target Area For a Long/Short at this point we looking for couple of things in order to enter a trade. Our confirmation will decide if we going long or short, Updates will be down below.


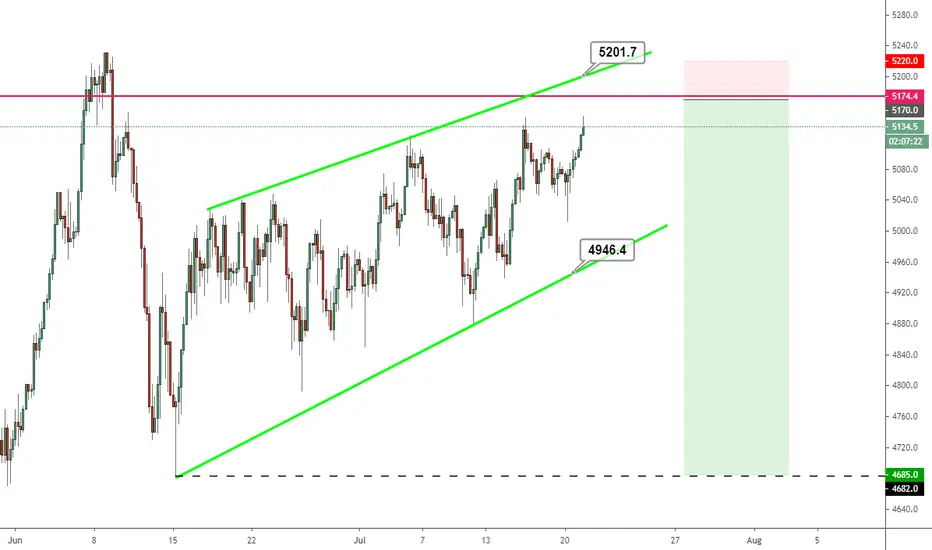
CAC40 - Limited upside within the wedge FRA40 - Intraday - We look to Sell at 5170 (stop at 5220)
Buying pressure from 5012 resulted in all the initial daily selloff being recaptured. Due to an Ending Wedge formation, we continue to treat extended gains with caution. Bespoke resistance is located at 5174. The trend of higher highs is located at 5200. The formation has a measured move target of 4681.
Our profit targets will be 4685 and 4650
Resistance: 5170 / 5200 / 5230
Support: 4947 / 4682 / 4650


FR40EUR is close to the Mirror Level!The trend is bullish now! If the price will cross the level and fix above we can trade buy position!
But don't rush with it because it can bounce temporarily.
Dear followers, the best "Thank you" will be your likes and comments!
Before to trade my ideas make your own analysis.
Thanks for your support!


CAC40 - Selling rallies near the wedge top FRA40 - Intraday - We look to Sell at 5160 (stop at 5210)
Buying pressure from 4940 resulted in all the initial daily selloff being recaptured. Buying posted in Asia. Bespoke resistance is located at 5165. The trend of higher highs is located at 5172. Preferred trade is to sell into rallies.
Our profit targets will be 4885 and 4850
Resistance: 5162 / 5165 / 5230
Support: 4885 / 4800 / 4682


Breaking the channelI suppose that the peak has been found after the COVID rally and maybe after the downturn, the correction is over. The corrective rising channel is about the break. Further decline should come beside not to intact the level of 5130!

