Next CAC40 (FCHI) index long moveTheis seems to be a provable long scenario for the CAC40 (FCHI) index in the short term
F40 trade ideas

Will CAC 40 See a Bullish Turn? Key Levels to Watch nextThe CAC 40, the benchmark French index, continues to trade around 7,496 during Friday's London session. Currently, the price is retesting a previous demand area, sparking interest in a potential bullish reversal pattern. I’m closely monitoring lower timeframes and daily charts for confirmation of a possible long position.
Market dynamics show retail traders are predominantly short, while smart money has shifted to long positions, signaling potential upward momentum. Additionally, the forecast indicator suggests a possible bullish seasonality for the index. However, it’s crucial to wait for a confirmed bullish reversal before entering any trades.
Patience remains key, and the next few days will be critical in determining the direction of the CAC 40. Stay tuned for potential entry opportunities as the index tests this significant demand zone.
✅ Please share your thoughts about CAC40 in the comments section below and HIT LIKE if you appreciate my analysis. Don't forget to FOLLOW ME; you will help us a lot with this small contribution.

FRA40 Eyes Support at 7,395 Before Bullish ReboundHello,
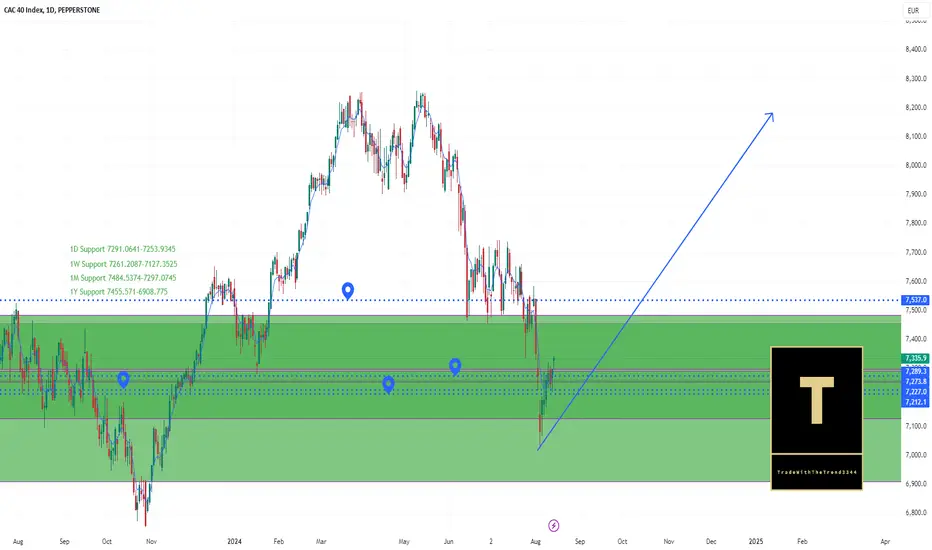
PEPPERSTONE:FRA40 is poised for further declines, approaching strong support at 7,395.95. Following that level, a bullish phase is anticipated to resume.
TradeWithTheTrend3344

WHAT'S FLOWING: BRENT | SUGAR WHITE | COCOA | USDCNH | NZDCHF | Brent Crude Oil (BRENT)
Sentiment: Bearish
Overview: Brent is currently facing downward pressure as it struggles to hold above critical support levels. Market sentiment has shifted amid concerns of reduced global demand, leading to a bearish outlook. Watch for further declines as Brent heads toward its lower support zone.
Key Level: Look for movement towards $80 if bearish momentum continues.
Sugar White
Sentiment: Bearish
Overview: Sugar markets have experienced a downturn, likely driven by increased supply forecasts and concerns about demand. The chart shows potential for further downside as traders continue to respond to bearish fundamentals.
Key Level: Price may target $520 as support, with resistance at $560.
Cocoa
Sentiment: Bearish - No Deal
Overview: Cocoa remains weak, with prices dipping as supply concerns ease. The market outlook suggests that current levels may continue to face selling pressure, particularly if there is no bullish catalyst to shift the sentiment.
Key Level: Watch for $2,900 as a potential support area, while $3,100 acts as a resistance.
USDCNH (US Dollar / Chinese Yuan)
Sentiment: Bullish
Overview: The pair has shown a strong upward trend, breaking through recent resistance levels. The USD continues to strengthen against the CNY as traders anticipate further economic divergence between the U.S. and China.
Key Level: The pair may push towards 7.34, with immediate support around 7.30.
NZDCHF (New Zealand Dollar / Swiss Franc)
Sentiment: Bearish
Overview: The NZDCHF pair continues to weaken as the kiwi faces headwinds from softer economic data, while the CHF remains steady. The bearish trend suggests further downside potential.
Key Level: Price may target 0.5200 if momentum sustains, with 0.5250 as resistance.
FRA40 (French Stock Index)
Sentiment: Bearish - No Deal
Overview: The FRA40 index is showing signs of weakness, struggling to gain any positive traction. The lack of bullish catalysts suggests a continued downtrend, especially with economic concerns looming over the Eurozone.
Key Level: Support near 7,000 remains critical, with potential resistance at 7,200.
CADCHF (Canadian Dollar / Swiss Franc)
Sentiment: Bearish
Overview: The CADCHF pair has been trading lower, reflecting the overall strength of the CHF against a weaker CAD. Continued bearish momentum is likely unless there's a shift in the broader sentiment.
Key Level: Key support near 0.6570 could be tested, with resistance around 0.6640.

CAC 40 index is bearishThe CAC 40 is an indicator traders use to measure the performance of the French economy, and, to a lesser extent, the EU economy. Some of the important factors influencing the CAC 40 are major political events, climate issues, major financial crises. Traders interested on the CAC 40 trading should also follow such French and the Eurozone figures as employment and unemployment rates, GDP, interest rate, import and export industry figures, etc.

FRA40: Bullish Potential with Key Support Levels in FocusHello,
The FRA40 is showing strong potential for further upside, having rebounded from the new 1-year low of 6750.62. Since then, the price has been steadily rising, indicating the emergence of a bullish trend. However, to confirm continued upward movement, it must establish a stable position above the 1-month pivot point (PP). If this doesn't happen, support levels may be tested again before any further gains can occur. Overall, the sentiment is currently neutral, with a long-term outlook leaning more toward bullish.
TradeWithTheTrend3344

FR40 Long
Long Idea on FR40. 2 legged pullback, bounce of the bottom of the channel and is at the 21EMA.TP at previous high. SL at previous candle close.


CAC40 - 4 months HEAD & SHOULDERS══════════════════════════════
Since 2014, my markets approach is to spot
trading opportunities based solely on the
development of
CLASSICAL CHART PATTERNS
🤝Let’s learn and grow together 🤝
══════════════════════════════
Hello Traders ✌
After a careful consideration I came to the conclusion that:
- it is crucial to be quick in alerting you with all the opportunities I spot and often I don't post a good pattern because I don't have the opportunity to write down a proper didactical comment;
- since my parameters to identify a Classical Pattern and its scenario are very well defined, many of my comments were and would be redundant;
- the information that I think is important is very simple and can easily be understood just by looking at charts;
For these reasons and hoping to give you a better help, I decided to write comments only when something very specific or interesting shows up, otherwise all the information is shown on the chart.
Thank you all for your support
🔎🔎🔎 ALWAYS REMEMBER
"A pattern IS NOT a Pattern until the breakout is completed. Before that moment it is just a bunch of colorful candlesticks on a chart of your watchlist"
═════════════════════════════
⚠ DISCLAIMER ⚠
Breakout Area, Target, Levels, each line drawn on this chart and any other content represent just The Art Of Charting’s personal opinion and it is posted purely for educational purposes. Therefore it must not be taken as a direct or indirect investing recommendations or advices. Entry Point, Initial Stop Loss and Targets depend on your personal and unique Trading Plan Tactics and Money Management rules, Any action taken upon these information is at your own risk.
═════════════════════════════

Bullish ideaThe index broke a bearish trend, bounced off it, and momentum is now leading towards the upside!

FR40 / FRANCE 40 Index Money Heist Plan on Bullish SideBonjour My Dear Robbers / Money Makers & Losers, 🤑 💰
This is our master plan to Heist FR40 / FRANCE 40 Index based on Thief Trading style Technical Analysis.. kindly please follow the plan I have mentioned in the chart focus on Long entry. Our target is Red Zone that is High risk Dangerous level, market is overbought / Consolidation / Trend Reversal / Trap at the level Bearish Robbers / Traders gain the strength. Be safe and be careful and Be rich.
Attention for Scalpers : If you've got a lot of money you can get out right away otherwise you can join with a swing trade robbers and continue the heist plan, Use Trailing SL to protect our money 💰.
Note: If you've got a lot of money you can get out right away otherwise you can join with a swing trade robbers and continue the heist plan, Use Trailing SL to protect our money.
Entry : Can be taken Anywhere, What I suggest you to Place Buy Limit Orders in 15mins Timeframe Recent / Nearest Swing Low
Stop Loss 🛑 : Recent Swing Low using 1H timeframe
Warning : Fundamental Analysis news 📰 🗞️ comes against our robbery plan. our plan will be ruined smash the Stop Loss. Don't Enter the market at the news update.
Loot and escape on the target 🎯 Swing Traders Plz Book the partial sum of money and wait for next breakout of dynamic level / Order block, Once it is cleared we can continue our heist plan to next new target.
Support our Robbery plan we can easily make money & take money 💰💵 Follow, Like & Share with your friends and Lovers. Make our Robbery Team Very Strong Join Ur hands with US. Loot Everything in this market everyday make money easily with Thief Trading Style.
Stay tuned with me and see you again with another Heist Plan..... 🫂

Whats Flowing: Crypto, European Stock Indices,Palladium Cryptocurrencies have been experiencing a period of volatility, driven by regulatory talks, technological advancements, and shifts in investor sentiment. Innovations such as DeFi (Decentralized Finance) and continued adoption of blockchain technologies in various sectors are key points of interest.
It's that simple. Nothing new.
European stock indices such as the DAX, FTSE, and CAC 40 have shown mixed responses to the current economic climate, marked by post-pandemic recovery challenges and inflationary pressures.

sellI have been waiting for this setup for a long time, everything is specified in the picture and do not pay attention to the rest of this text, I am only typing to get permission to publish.

Cac 40 (Euronext) may fall to 7465.00 - 7520.00Pivot
7610.00
Our preference
Short positions below 7610.00 with targets at 7520.00 & 7465.00 in extension.
Alternative scenario
Above 7610.00 look for further upside with 7661.00 & 7710.00 as targets.
Comment
The upward potential is likely to be limited by the resistance at 7610.00.
Supports and resistances
7710.00
7661.00
7610.00
7576.00 Last
7520.00
7465.00
7415.00
Number of asterisks represents the strength of support and resistance levels.

FR40EUR EXPECTACTIONSFR40EUR expected to have the bullish move as an outcome of HCOB fundamentals, which is worse for EUR this cause XXXEUR to have bullish strike including FR40EUR
I expect to take long at the near most liquidity engineering

Paris Olympics OutcomeHere's a setup of the CAC40, France's top 40 stocks. I believe it is on a bullish ride as well as other indices. It has the best setup in my point of view.
DISCLAIMER NOTICE!
This is only my opinion and not a financial advice to set up a trade or invest. Trading or investing without knowledge is highly risky.

FRA40 Stabilizes at Key Support, Bullish Momentum BuildingHello Everyone,
The FRA40 recently reached a 6-month low at 7028.18, where it has found support. The 1-year, 1-week, and 1-day pivot points have also served as supports so far. While it has stabilized at this level, further support tests cannot be ruled out. Nevertheless, conditions are gradually aligning for a potential bullish movement!
TradeWithTheTrend3344
France 30 Stock Price & AnalysisWithin a 100K Account Balance the split on Trade & Risk Management = 1/10% - 1/20% margin as an Execution Range, to set up an Order Entry and select a per Trade on Average, to avoid any drawdown hit regarding to Stop Loss & to execute Risk on Management Specifics. Trail Stop efforts are a Focus of Attention to the set up in general when Volatile-Price-Action is involved, mainly because of the usage of an Intraday-Scalp-Position tool on behalf on the Trade Plan in general
Key indicators on Trade Set Up in general;
1. Push Set Up
2. Range Set Up
3. Break & Retest Set Up
Active Sessions on Relevant Range & Elemented Probabilities;
* Asian(Ranging) - London(Upwards) - NYC(Downwards)
* Weekend Crypto Session
Statistics
Market Capitalization (EUR)
Full 2,428
Free float 1,694
Annualized (%)
2 Year 12.37% 3.17
3 Years 4.75%
5 Years 6.19%
Since Base Date 31-12-1987 5.67%
Components (full) (EUR)
Average 60.6
Median 32.9
Largest 356.9
Smallest 5.9
Conclusion | Trade Plan Execution & Risk Management on Demand;
Anglo American PLC Stock Price & Analysis: Overall Consensus | Neutral

Predicting next pattern I expect this pattern on CAC40 in the next weeks.
Range :
: resistance level
: Major support level

F40 to Break 7000Yesterday was quite turbulent for all equity markets. In this market, the F40 , Buyers defended just above the 7000 level. Surely this is cheap and a great time to buy.
There is a significant area of Daily Support at 7070. It has on many occasions in the past.
Volume yesterday was Ultra High , reflecting the fight between the sell and buy side.
No real clear winner.
Look at today on very little volume, price again ebbs lower.
The real Demand area lies at 6800.
It is possible for the buy side to be consumed and present support to break , and expose
the Demand below. This is the near- term Target.

CAC40 setting Support to Continue Climbing Regardless of low earnings that have been reported this month investors’ sentiment on future rate cut is still high.
The index is retesting support level and have reached the 13% gap needed to start forming a reverse trend and becoming weeks.
This is strictly not a financial advice, but rather an idea. You should always make your own financial decisions before investing or taking any financial decision.


