Euro Stoxx 50 - Daily - Could still capture a bit of the upsideTrade Alert
We could still catch a bit of that uprise, especially if the index moves above its recent highs of 3436.5. The move could open the path towards the 3460 level initially and then maybe testing the long-term downside resistance line, taken from the highest point of January. This is where the price could stall for a while.
On the downside, a break below the 3405 zone, could set the stage for a possible drop down towards the 3350 area, which acted as good support on the 15th of August.
Always have your SL in place.
STOXX50 trade ideas

EU Stocks 50 Index - Bullish OpportunityWe can expect this EU Stocks 50 Index to continue it's bullish move up as soon as it breaks the 50 ema on the 4H timeframe chart.
20 EMA is the support and as long as it holds strong, this move is active.
Trade Safe.


Europe 50 (STOXX) - 3340/ 3350 key level (Short bias)Looking for shorts below 3340/ 3350 towards 3260, even 3100.

Potential SX5E Short-Term Buy Opportunity
Tested support of around 3275 points. RSI at oversold level. Possible retracement from current downtrend up to fib level of 0.236 with the target level being around 3350 points. More confirmation required but represents a potential buying opportunity in the short term.


Short Euro Stoxx 50 - Downside volitility!See confluence of 50MA (h4) , previously inflected horiz resistance & 50% retracement.
I have went short here at yesterdays open. SL placed just above market high. This will moved once I see a reaction to the downside further improving my R:R on the trade. I always place my SL's at the point where my opinion is proved wrong. If a new high is printed here then my opinion of a downside confutation is incorrect.
My target will be a retest of the local market low. We can see there is volatility to the downside here (swift moved to the downside last week followed by a weak upside move.
Zooming out to a macro view - there is a case for a larger H&S forming.

EURO STOXX in the same boat as the DAXAlmost identical setup on the EURO STOXX as on the DAX. Big short setup, first set up in a potential new bearish trend. The pattern was triggered by a nice big selloff candle, indicating strong bearish momentum. Will it continue? On balance of probability it should. Either way, I wouldnt want to hold any stake in EURO STOXX 50 or DAX at this time.
Trade safe. Trade smart.

EuroStoxx 50: Could Move Much LowerComments on the chart. There could be a retracement to correct the big downmove today but as long as 3480 is not taken out it is a better selling area/short entry

Possible short. Seems to be respecting the trendline.Possible short. Seems to be respecting the trendline.
Major Support coming up as well. Wait for a signal but looks decent

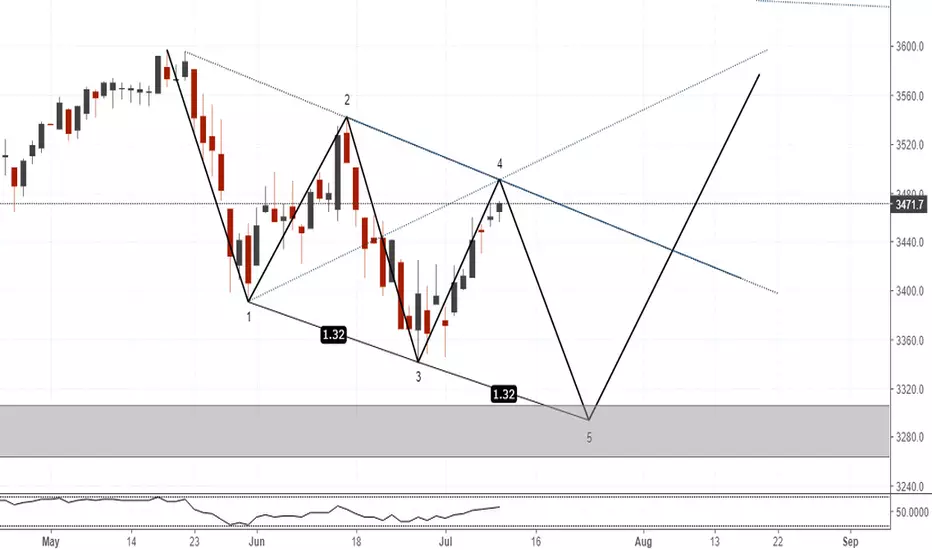
EURO STOXX50(daily chart). Potential three drives, Geo.EURO STOXX50(daily chart). Potential three drives, Geo.
Bear Flag Incoming - Let's short it!We are currently at the TOP of a Bear Flag Pattern and we have an excellent Risk Reward I put my Stop Loss and Take Profit on the Graph.
The Volume are also decreasing which validate the pattern.

Short ES50 Target 1 - 2,860; Target 2 - 2,564The EuroStoxx50 could have finished its correction wave ii of the blue 3 down. Then there are now directly 2,860 points for the wave 3 on the program. The final of the 5 of the c would be at 2,564.

SX%E - Long term bearish outlook - 300 point drop!Very bearish market geometry on display in the Euro Stoxx 50 chart. Bearish are certainly in control with bulls failing to create new highs this years and also a recent failed to re-enter the trading range.
P&F count for this one brings us down the 3100, this ties up nicely with a the previous horizontal resistance developed in 2016.
Good luck!
For more info on potential entry points Join my discord! discord.gg

STOXX 50If the STOXX 50 breaks the blue trendline (I mean, if it closes below it), there is a serious possibility that it will continue to fall (at least) until the area 3330/3335 points.

EuroStoxx 50: I am bearish against the 3600 highComments on the chart.
The most important thing to note is that for this to play out the high must be in
By the way, another scenario that can happen is a triangle however the downmove has no discernable divisions into 3 waves. A triangle will be bullish imho

EuroStoxx below 3410/05 risks a slide to the May low at 3385/80EuroStoxx below 3410/05 risks a slide to the May low at 3385/80. A break below the 50% Fibonacci at 3374 targets 3366 & 3359/55.
Holding 3410/05 allows a recovery to 3428/30 with strong resistance at 3439/42. Shorts need stops above 3450. A break higher meets strong resistance at 3461/64. Shorts need stops above 3470.

EURO STOXX 50 - Long-Term Outlook.The leading European index EURO STOXX 50, could see a new lower low in the 3,060 area if breaks down the short-term ascending trend-line.

EUROStoxx50(4hr chart). At resistance, Bearish Wedge, 200 sma.EUROStoxx50(4hr chart). At resistance, Bearish Wedge, 200 sma.


Euro Stoxx 50 index - Symmetrical Triangle formation.50/50 bias formation. Mostly like bullish outbreak, given positive signs in US Equities.

Euro Stoxx 50 - Daily - Getting squeezed and ready for a moveTrade Alert!
We will make a difficult call here and say SELL. Certainly, for this, we will have a careful stop.
The index is really getting squeezed right now and it looks like a strong move soon is inevitable.
As always, don't forget your stops.
