STOXX50 trade ideas


Short term top for Stoxx 50?The parallel channel and the fact that wave 5 may be the same length as wave 1 might suggest a short term top is in for this index.


STOXX / H4 : End of bullish waves, retracement should comme soonSinewave and Momentum are both having hard time to trigger signals here because of ECB press conference stimulus that has driven sharp and faster price movements. Anyway 3641 is a key level that I had on my charts for weeks.
We're testing it and as it corresponds to the final wave of a potential expanding triangle structure, that would be a shame not trade it and share this idea with you !
I'm now short for a correction (SO THIS IS COUNTER TREND and I'm of course doing this with 0,5 leverage and a large stoploss set at 2% risk > 1% capital loss in case of invalidation. This means a stop loss set a 3715 which is much more that required and should leave me out of troubles !).
Target 1 is set to 38% retracement.
Target 2 at 50%.
I don't see this corrections going further that 50% as we had a very bullish structure on the impulse.
Anyway no matter how bullish we were, this was still a first bullish wave... and at this stage shorting can only be considered to pay for future long positions stops ;)
YES I'LL BUY EURO EQUITIES AFTER THAT RETRACEMENT ! (just to be clear..)
Hope this idea will inspire some of you ! I'ld appreciate any like/follow if you feel like it deserve it ;)
You can check my indicators via my TradingView's Profile : @PRO_Indicators


Euro Stoxx 50 - more upsideI have highlighted a few areas where parallel channels and key Fibonacci numbers might suggest some upside targets for this index when coupled with my EW count. My only concern here is that perhaps it all looks too obvious and the market may have other ideas.....

short the eustx50Just got this trade on the 15 mins chart again, based on the bat pattern.
Success
RandR

Eurostoxx long. This is a perfect trade Review:
After the last analysis from September 7, the Eurostoxx did not fall below 3363 and thus continued its forecasted upward trend. We were right in our expectation that the index didn't touch 3400 anymore. You can read the old forecast here
Forecast:
This develops to a perfect trade. Now we have to prepare for the start of a correction wave in the area around 3640, which will reach minimum 3532. It should find its end 3476 at the latest. After the correction has been completed, we expect another dynamic upward wave in the direction of 3657.
The long-term scenario remains unchanged. We will update the long term picture when the uptrend reaches its peak.


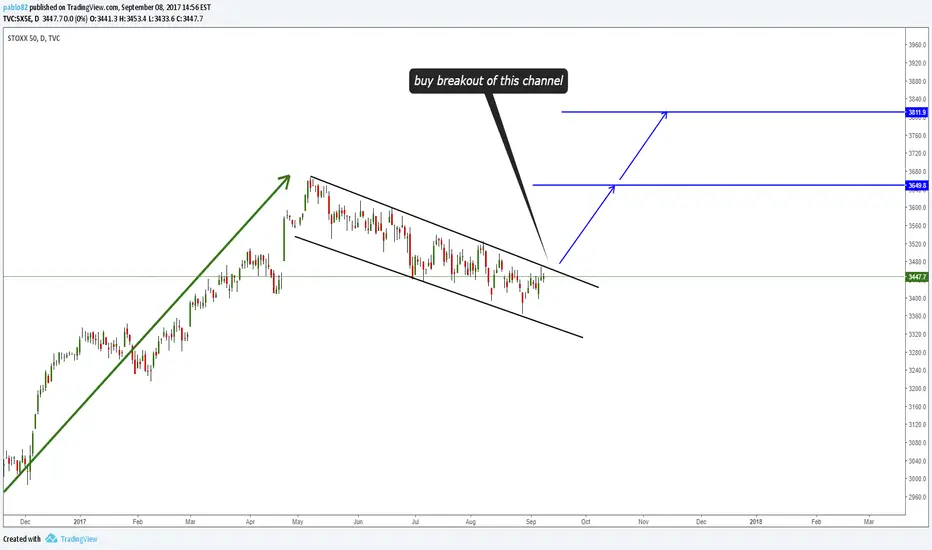
BUY SETUPWe have a nice descending channel in development as a correction from the uptrend.
I expect breakout from the channel soon and you can use it as entry point for long positions to TP levels as marked on chart.
Eurostoxx long The Eurostoxx completed its corrective formation and is ready to skyrock again. Stop Loss at 3360 , minimum Target 3700. After this upwave is completed the show will be over.


From now just buy dips- The 3 months deterioration period seems to be over. Price broke back above downtrendline, after major bullish trendline acted as good support last week.
- Ichimoku is back to neutral with some bullish bias ahead. Equilibrium level and now bullish support is 3450+. Price is above Kijun, right at spot Kumo top, which could be some short term resistance.
- Heikin-Ashi is bullish, with increasing momentum. Given the haOscillator's relative high value, we may see some consolidation, or minor pull back before next leg up. If it happens, use this dip to go long.
- EWO switched to bullish
Strategy: try to buy dips to 3450-3475, initial stop at 3400


DAX 1H SELLNot bad sell opportunity on the dax pair. The price have made double top and retraced 50% in my opinion we may go to 127.2% extention and even break below previous daily lows due to the NKorea issues and GOLD buying moment from the investors


Strong and interesting signal to buy on the index EURO STOXX 50!
On the weekly chart of the European index EURO STOXX 50, which includes the leading "blue chips" for the Eurozone, rested on the ascending channel with a beautiful hammer.
Let's move on to the daily chart. Usually we buy from the middle of the hammer - this is the level of 3480.00, also there is our upcoming weekly channel: Buy Limit 3408.00, SL = 3347.00, TP = 3678.00 .
If you go back to the weekly chart of the index, you can see that the bullish flag is being drawn - a harbinger of further growth. But until we break through its upper limit, we are talking about a potential flag.
Oleg Svirgun

