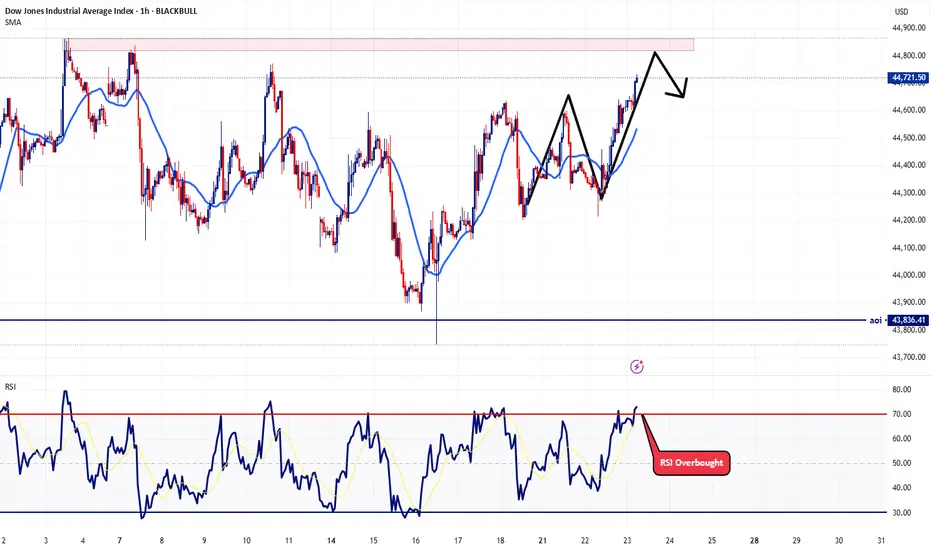
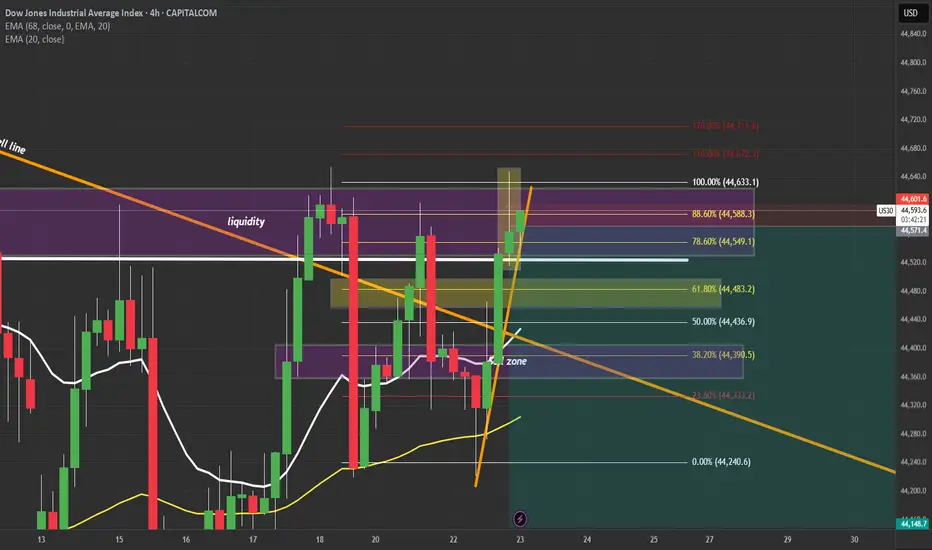
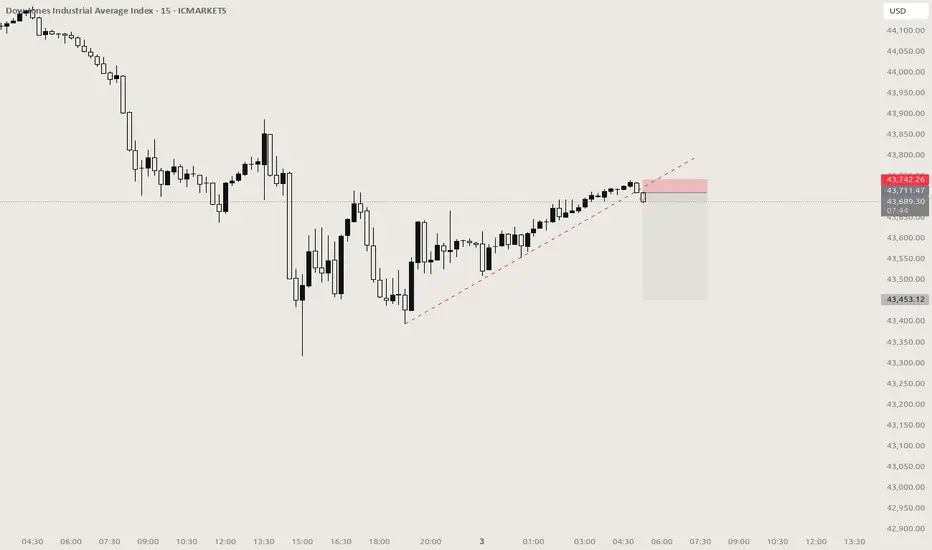
US30 - What I believe will happen todayConsidering today is now Wednesday and Wednesday's have a consistency of being one of those off days. Primarily because usually there are Fed speeches on this day that manipulate the market. With that said, I'm expecting price action to play out how I plotted the arrows on the chart. I believe there is still some further upside for today but then I believe we might get that intraday correction around 11:am - noon EST.
Let's see how today plays out. Trade safe
US30FU trade ideas
US30 US30 maintains a bullish outlook, supported by improving economic data, rotation into industrials and value stocks, and resilient corporate earnings. As long as price holds above key support levels, the broader uptrend remains intact.

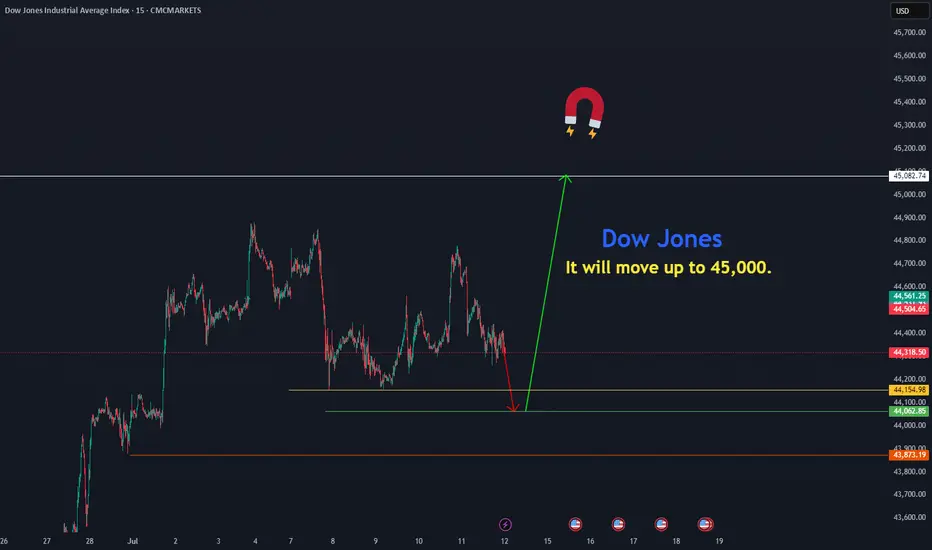
Dow Jones move upThe Dow Jones is resuming its rally toward 45,082 from the price zones of 44,154.97 and 44,000.
CMCMARKETS:US30
US30: The Market Is Looking Down! Short!
My dear friends,
Today we will analyse US30 together☺️
The recent price action suggests a shift in mid-term momentum. A break below the current local range around 44,306.1 will confirm the new direction downwards with the target being the next key level of 44,263.8..and a reconvened placement of a stop-loss beyond the range.
❤️Sending you lots of Love and Hugs❤️

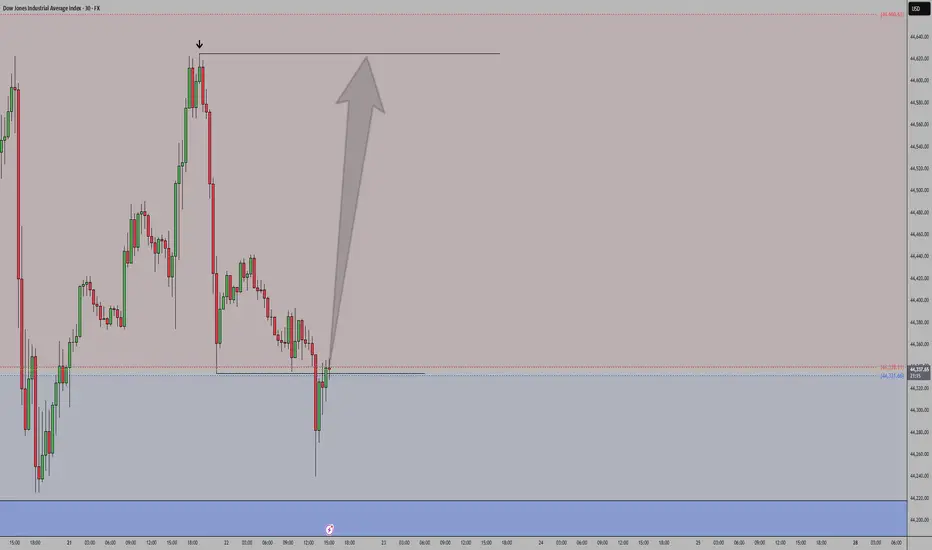
US30 Dow Jones New All Time HIGHMost people over complicate things, mostly the idea is right in front of you yet most don't believe in what they trade; simple bull flag, simple new ATH, that's it. believe it.
US30 | Inverted Hammer at Key Supply Zone – Reversal or BreakoutUS30 just printed an inverted hammer on the 4H at a major supply zone (44,550–44,600). This is a critical decision point:
✅ Bearish Case:
If price rejects and closes back below 44,530, sellers could take control with targets at 44,380 → 44,180 → 44,020.
✅ Bullish Fakeout:
If price breaks and holds above 44,620, expect a push toward 44,700 and 44,900.
📌 What I’m Watching:
Rejection candle + bearish close → short entries.
Strong breakout candle with retest → long continuation.
Key Levels:
🔴 Resistance: 44,550–44,600
🟢 Support: 44,380 → 44,020
⚠️ Manage risk carefully. Volatility is high and liquidity hunts are common in this zone.
💬 Do you think we reject here or break out higher? Drop your thoughts below!
#US30 #DowJones #PriceAction #SmartMoney #TradingView #TechnicalAnalysis #IndicesTrading
Buy
Rejection Level
Daily Volume
Market Structure Shift
London Session
Trend Line Break
Untapped Order Point
US30 continues to exhibit bullish momentumThe US30 index continues to exhibit bullish momentum, driven by strong earnings reports and robust U.S. economic data. The key support zone around 44,300 has held firm, reinforcing confidence among buyers.
As long as the price remains above 44,300, the uptrend is expected to persist Upside target: 45,000 remains in focus. a focus on the 1H Candle close above 44,000 we could expect price could push more upside.
You may find more details in the chart Trade wisely best of luck buddies
Ps: Support with like and comments for better analysis Thanks for Supporting.

US30Recent COT data shows rising net short positions on U.S. equity indices, reflecting bearish sentiment from institutional traders toward the Dow (US30). This indicates growing caution or expectations of downside pressure.

NQ thread: Short ideaMonday started off bullish, but only to drop at the end of the session.
Here is a thread on what is happening and on which narratives I view the market
Starting off with the 4H Time frame, we witnessed NQ and ES taking last weeks high.
YM did not.
This is the first stage of the movement. To find the second stage, we need to dive deeper into the lower timeframes..
Dow Jones is Nearing an Important Support!!Hey Traders, in today's trading session we are monitoring US30 for a buying opportunity around 43,950 zone, Dow Jones is trading in an uptrend and currently is in a correction phase in which it is approaching the trend at 43,950 support and resistance area.
Trade safe, Joe.

Litty Like US30!!I'm purely going off the Week chart. 4hr MSS+ 4hr BPR gives me reasons to buy price. I'm targeting the Equal Highs on the Weekly chart.

US30 Rejected Support at 43340 – Bearish Below 43960US30 – Overview
The price rejected perfectly from the projected support at 43340 and currently maintains a bearish momentum as long as it trades below the pivot level at 43960.
As long as the price remains under this level, we expect a move toward 43630, and a break below that may lead to a retest of 43340.
However, a 4H candle close above 43960 would shift the outlook to bullish, with upside potential toward 44170 and possibly 44360.
Support: 43630 • 43340
Resistance: 44170 • 44360
Bias:
🔻 Bearish below 43960
🔺 Bullish confirmation on 4H close above 43960

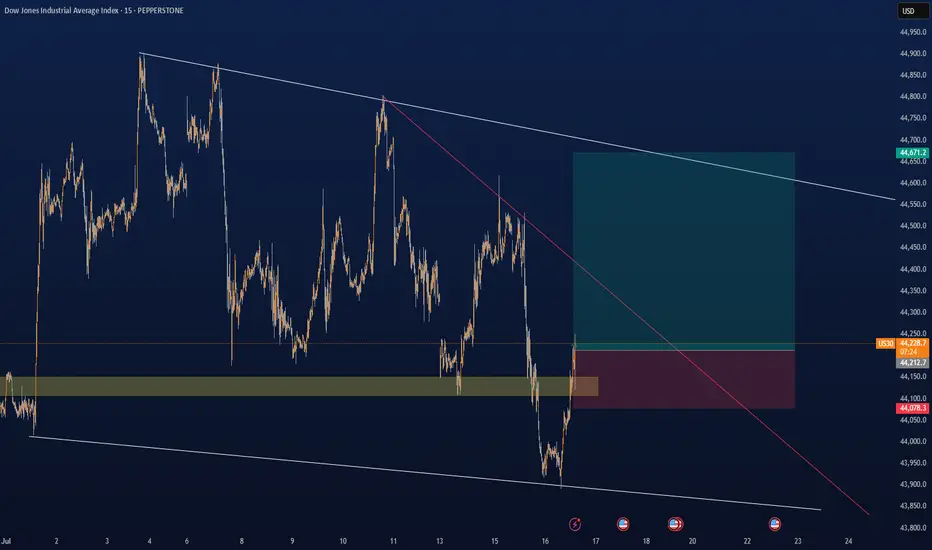
US30 ShortUS30 Short Setup – Bearish Retest Play
Idea: Looking for a short opportunity after a clean break of structure and trendline.
Breakdown:
Trendline Break: The rising trendline (yellow) has been decisively broken, signaling a shift in market structure.
Structure Shift: We saw a strong impulsive move to the downside, breaking previous higher lows and confirming bearish intent.
Key Resistance Zones: Price is now pulling back toward a key supply zone between 44,100 – 44,300, which aligns with previous support-turned-resistance.
Plan: I’m anticipating a potential lower high formation around this zone, followed by rejection and continuation to the downside.
Target Zone: My short target is the demand area around 42,900 – 42,600 where price last consolidated before the previous rally.
Invalidation: If price reclaims and holds above 44,400, the short idea becomes invalid.

US 30 Index – Potential Rebound or Deeper Retracement Ahead?Just as the US 30 became the last of the three major US indices to register a new all time high last Monday at 45160, on a final wave of positivity generated by the announcement of a trade deal between the US and EU, it was snatched away again as traders used the up move to take profit on longs.
This initial fall evolved into 5 straight daily declines which took the index from its record high of 45160 on Monday to a Friday close at 43591 as the sell off accelerated, driven by disappointment of a more hawkish than expected Fed, a new wave of trade tariffs from President Trump, weaker Amazon earnings , and on Friday, perhaps the biggest surprise of all, a Non-farm Payrolls release that showed the US labour market may be weakening faster than anticipated.
Looking forward, with the shock of Friday’s data reverberating through markets, US 30 traders still have lots to think about this week. The US ISM Services PMI release is due at 1500 BST on Tuesday. Service activity has been the major driver of growth in the US economy for the last 18 months, so this new update could have a big influence over where the US 30 index moves next. Any reading below 50 = economic contraction, while readings above 50 = economic expansion, and traders could well be focused on how this month’s print stacks up against last month’s reading of 50.8.
The earnings releases of 3 bellwether US corporates may also be relevant, given their US 30 index weightings. Caterpillar reports its Q2 results before the market open on Tuesday, with McDonald’s and Walt Disney reporting before the open on Wednesday. Traders may be looking to compare actual earnings against expected, alongside assessing any future revenue guidance that is provided against the current trade tariff operating environment.
Now, while the US 30 index has opened this new trading week on a more stable footing, currently trading up 0.25% at 43705 at the time of writing (0530 BST), assessing the technical outlook for the week ahead could also be useful for traders.
Technical Update: Deeper Retracement Risk Emerging?
While it might be argued that it was the reaction to the latest US employment data that saw US equities encounter fresh selling pressure, as the chart below shows, prices were already declining into Friday’s payrolls release.
Price weakness was materialising in the US 30 index right after it posted its new all-time high on Monday July 28th at 45160, and traders might now argue that last Thursday’s close below support provided by the Bollinger mid-average, currently at 44412, was the first potential indication that a more extended phase of price weakness was possible. The case was then perhaps strengthened by Friday’s negative reaction to the payrolls data, which saw closing breaks under support provided by the July 16th last correction low at 43770.
There is of course no guarantee that this price action will result in a retracement of the April 7th (36440) to July 28th strength (45160), but assessing what may be the potential support and resistance levels to monitor this week could be helpful, if the recent volatility continues to dominate price action at the start of August.
Possible Support Levels:
Last week’s price decline held at the 43337 level which was the August 1st low, and having previously found buyers at this point, they may be found again. As such, this 43337 level could now prove to be the first support focus for the week ahead.
Closing breaks below 43337, if seen, could lead to the possibility of further price declines, opening potential to test the next support at 41824, which is the 38.2% Fibonacci retracement of April to July 2025 price strength (see chart above).
Possible Resistance Levels:
Having now seen the Bollinger mid-average for the US 30 index turn lower after last week’s fall, this may now be the first resistance level to watch on any subsequent rally higher. It currently stands at 44442 and watching how this level is defended on a closing basis could be useful.
If a more sustained phase of price strength is to materialise, it could be closing breaks above the mid-average at 44442 that increases the possibility of it happening. Such moves could then see retests of the July 28th all-time high at 45160, possibly higher if this level is then breached on a closing basis.
The material provided here has not been prepared accordance with legal requirements designed to promote the independence of investment research and as such is considered to be a marketing communication. Whilst it is not subject to any prohibition on dealing ahead of the dissemination of investment research, we will not seek to take any advantage before providing it to our clients.
Pepperstone doesn’t represent that the material provided here is accurate, current or complete, and therefore shouldn’t be relied upon as such. The information, whether from a third party or not, isn’t to be considered as a recommendation; or an offer to buy or sell; or the solicitation of an offer to buy or sell any security, financial product or instrument; or to participate in any particular trading strategy. It does not take into account readers’ financial situation or investment objectives. We advise any readers of this content to seek their own advice. Without the approval of Pepperstone, reproduction or redistribution of this information isn’t permitted.

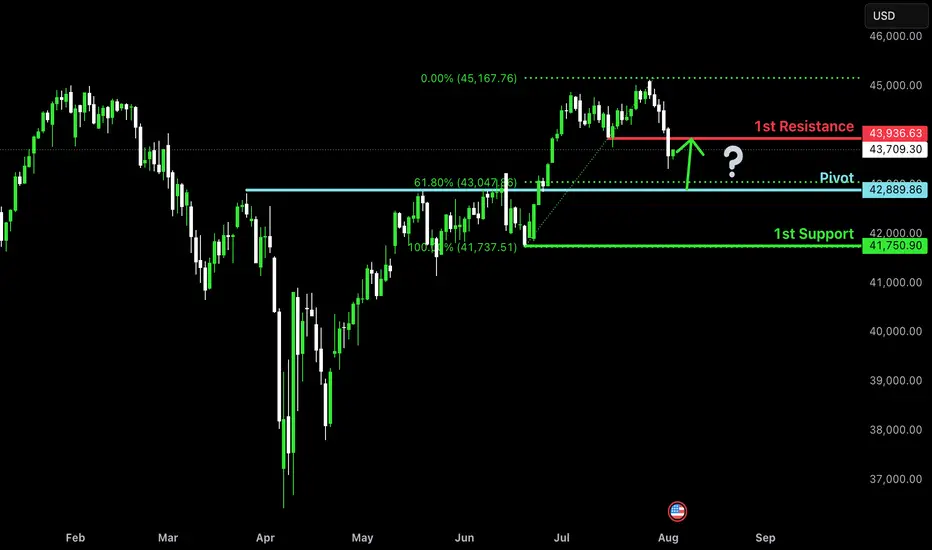
Falling towards pullback support?Dow Jones (US30) is falling towards the pivot and could bounce to the 1st resistance.
Pivot: 42,889.86
1st Support: 41,750.90
1st Resistance: 43,936.63
Risk Warning:
Trading Forex and CFDs carries a high level of risk to your capital and you should only trade with money you can afford to lose. Trading Forex and CFDs may not be suitable for all investors, so please ensure that you fully understand the risks involved and seek independent advice if necessary.
Disclaimer:
The above opinions given constitute general market commentary, and do not constitute the opinion or advice of IC Markets or any form of personal or investment advice.
Any opinions, news, research, analyses, prices, other information, or links to third-party sites contained on this website are provided on an "as-is" basis, are intended only to be informative, is not an advice nor a recommendation, nor research, or a record of our trading prices, or an offer of, or solicitation for a transaction in any financial instrument and thus should not be treated as such. The information provided does not involve any specific investment objectives, financial situation and needs of any specific person who may receive it. Please be aware, that past performance is not a reliable indicator of future performance and/or results. Past Performance or Forward-looking scenarios based upon the reasonable beliefs of the third-party provider are not a guarantee of future performance. Actual results may differ materially from those anticipated in forward-looking or past performance statements. IC Markets makes no representation or warranty and assumes no liability as to the accuracy or completeness of the information provided, nor any loss arising from any investment based on a recommendation, forecast or any information supplied by any third-party.

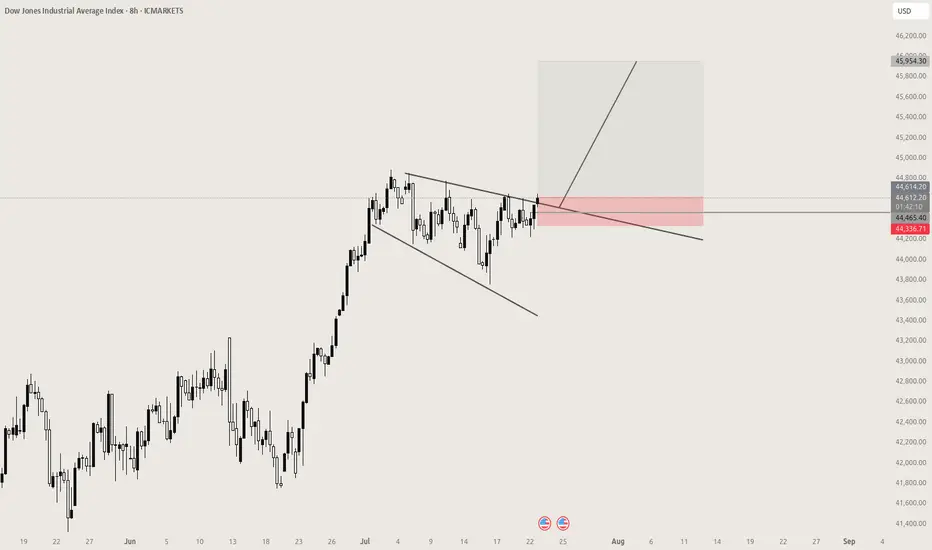
Anticipating DJIOn the daily timeframe, the current position of the Dow Jones Industrial Average (DJI) is projected to follow one of three possible scenarios:
Scenario 1 (Black Label):
DJI is currently in the process of forming Wave iv of Wave , implying that any short-term rebound is likely to be limited. The index may test the resistance area between 43,953–44,142, but remains vulnerable to further downside correction thereafter.
Scenario 2 (Red Label):
In this scenario, Wave 4 is considered complete, allowing DJI to resume its upward momentum. A breakout would signal the start of Wave 5, targeting the 45,324–46,465 range for a potential new higher high.
Scenario 3 (Blue Label):
Here, DJI is assumed to be in the midst of Wave 4 of Wave (5). A corrective move is expected first, potentially revisiting the support zone around 42,262–43,028, before continuing its bullish trend to form a new higher high.

