US30 Technical Breakdown – 07/24/2025📍 US30 Technical Breakdown – 07/24/2025
🔥 New highs achieved — bulls pushed straight through the 44,867 ceiling and tagged 45,082 before pulling back slightly. This is a key psychological level, and price is now consolidating just below.
We’ve officially shifted into breakout territory. Momentum is strong, and EMAs are fully bullish. But after such a run, we may be due for a retest or short-term correction. Let’s break it down 👇
📊 Current Market Structure:
✅ Series of higher highs & higher lows
✅ EMA 9 > EMA 21 > Price (bullish structure)
✅ Breakout from range: 44,867 → 45,082
🧱 Minor resistance at 45,050–45,082
⚠️ Watch for pullback to 44,750–44,800 zone
🔑 Key Levels:
🔼 Resistance:
45,050 → 45,082 (fresh supply zone)
45,200+ (blue sky if broken)
🔽 Support:
44,867 (former resistance turned support)
44,734 (EMA confluence)
44,450–44,600 (demand zone)
🧠 Market Bias:
📈 Still bullish, but extended.
Above 44,867 = continuation zone
Below 44,734 = momentum shift likely
Rejection at 45,082 could give scalpers a play short 🔄
💡 Potential Trade Setups:
📈 Breakout Buy (Momentum Entry):
Entry: Above 45,100
TP1: 45,200
TP2: 45,300
SL: Below 45,040
US30FU trade ideas
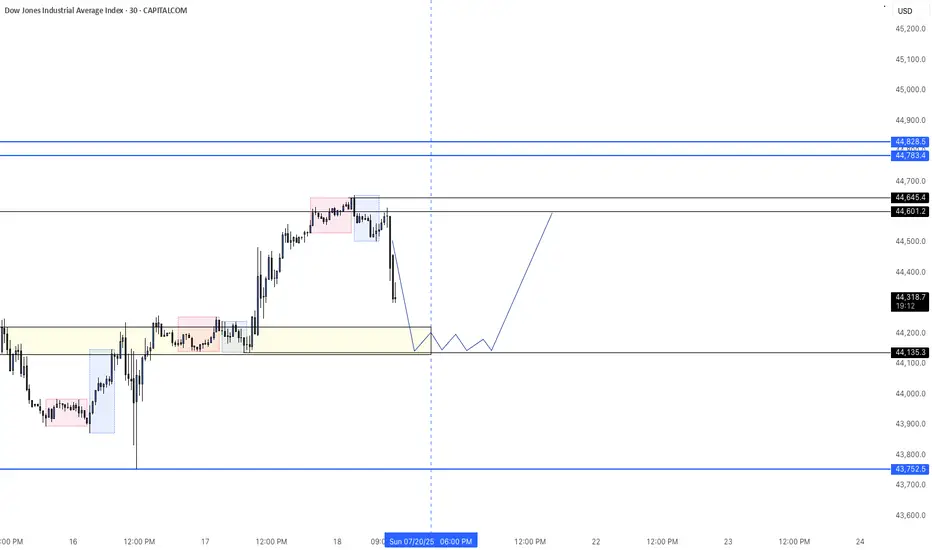
US30 - LONGPrice has reached a key level after yesterday's push back down. Had a buyers come into the market this morning at market open before dropping once again. Expecting buyers to take back control and retest previous highs.
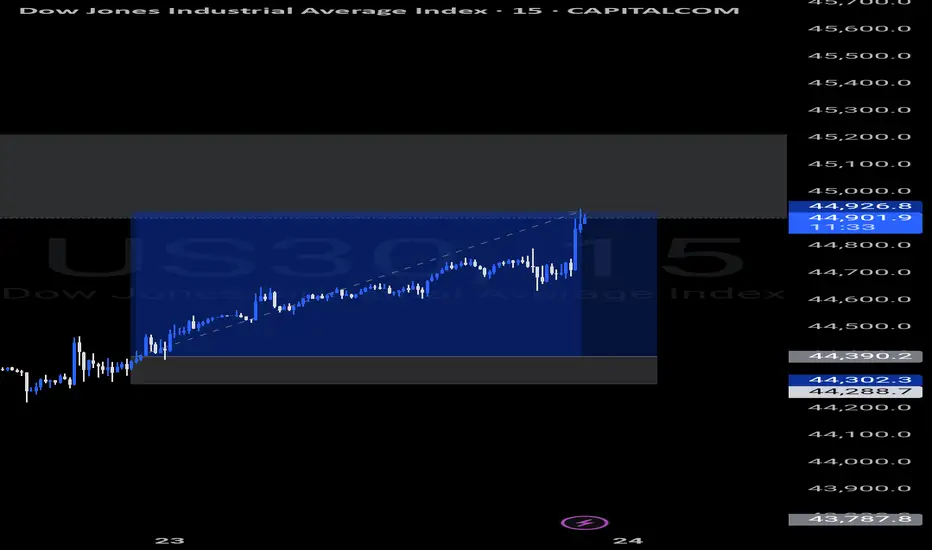

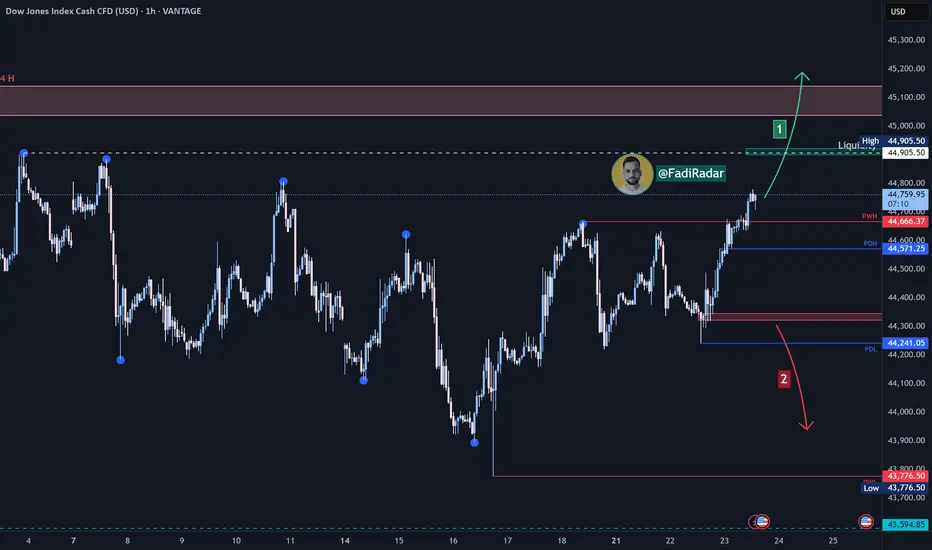
Dow Jones Index US30 Analysis:🔹 The index is approaching a key liquidity zone near 44,905 USD.
1️⃣ If price breaks and closes above 44,905, this could trigger a bullish continuation toward 45,100 USD.
2️⃣ However, if the price fails to break above and bearish momentum appears, a pullback is expected to test 44,570 and 44,320.
🔻 A confirmed break and close below 44,320 could resume the bearish trend and open the way toward 43,900 USD.
⚠️ Disclaimer:
This analysis is not financial advice. Please monitor the markets carefully before making any investment decisions.
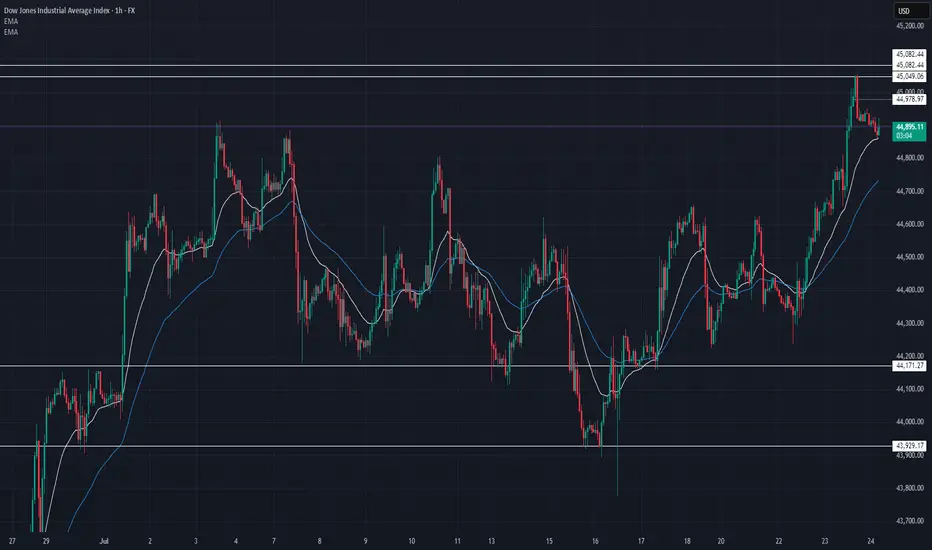
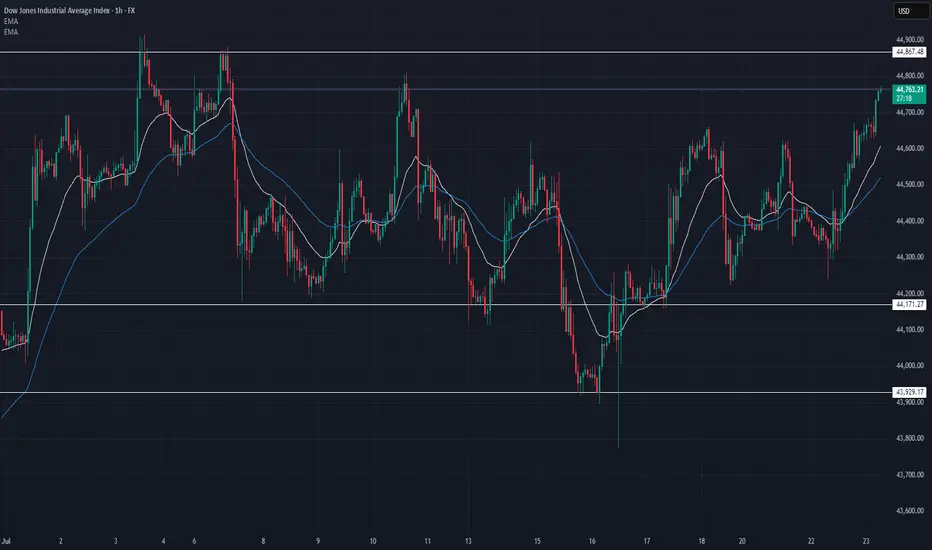
US30 Update – 07/23/2025📍 US30 Update – 07/23/2025
The bulls are back in control 🚀
After consolidating below 44,450, we finally saw a strong breakout above the mid-range and EMAs. Price surged straight into the 44,760–44,867 resistance zone with strength, riding the 9/21 EMA crossover 🟢
We're now testing a major supply zone, so momentum traders should watch for a reaction here.
📊 Market Structure:
✅ Clean higher lows
✅ Breakout above 44,600 resistance
✅ EMAs aligned bullish on 1H
✅ Bullish engulfing + follow-through
🔑 Key Levels:
🔼 Resistance: 44,764 → 44,867
🔽 Support: 44,450 → 44,171
🧠 Market Bias:
Short-term bullish ✅
➡️ Holding above 44,600 = bullish continuation
➡️ Rejection at 44,867 = possible pullback/retest
💡 Trade Scenarios:
📈 Breakout Continuation (Aggressive Long):
Entry: Above 44,780
TP1: 44,867
TP2: 44,950
SL: Below 44,700
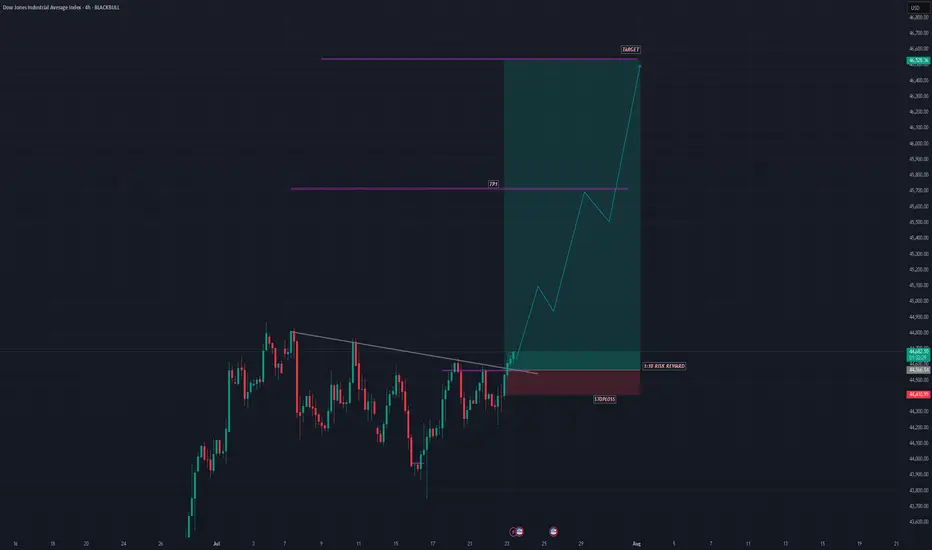
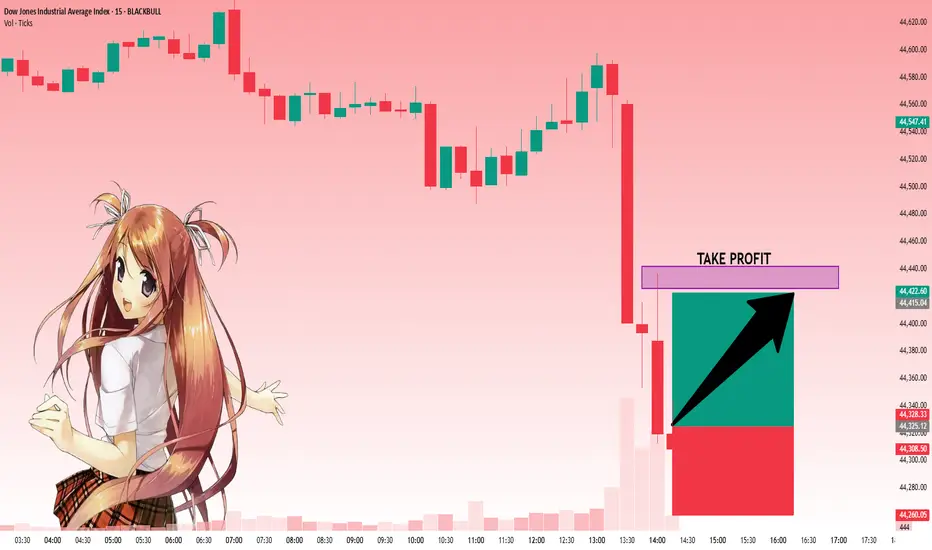
US30 SHOWING A GOOD UPWARD MOVE WITH 1:10 RISK REWARDUS30 SHOWING A GOOD UPWARD MOVE WITH 1:10 RISK REWARD
DUE TO THESE REASON
A. its following a rectangle pattern that stocked the market
which preventing the market to move any one direction now it trying to break the strong resistant lable
B. after the break of this rectangle it will boost the market potential for break
C. also its resisting from a strong neckline the neckline also got weeker ald the price is ready to break in the outer region
all of these reason are indicating the same thing its ready for breakout BREAKOUT trading are follows good risk reward
please dont use more than one percentage of your capital follow risk reward and tradeing rules
that will help you to to become a better trader
thank you
US30 BUYS!!!I see price creating a 4hr bullish structure to take price towards those equal highs because Equal Highs is a magnet for priice.

07/22 Trade for US30The variation was tricky so i had to take my patience and set the stop loss with the low of the candle bar with volume.
1. Variation(Yellow) : Downtrend losing momentum
2.Wick(Blue): Wick rejecting going down
3. Volume(Red): Wait for momentum to go up

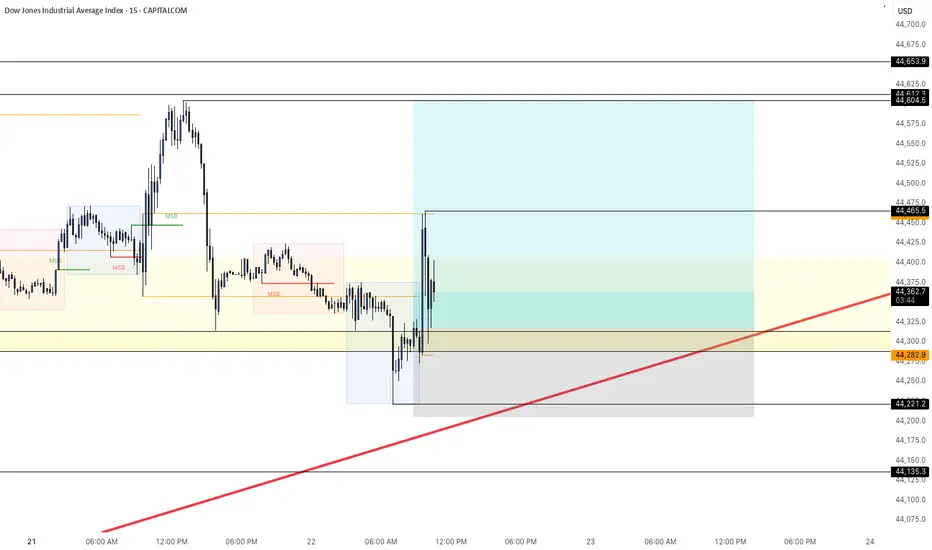
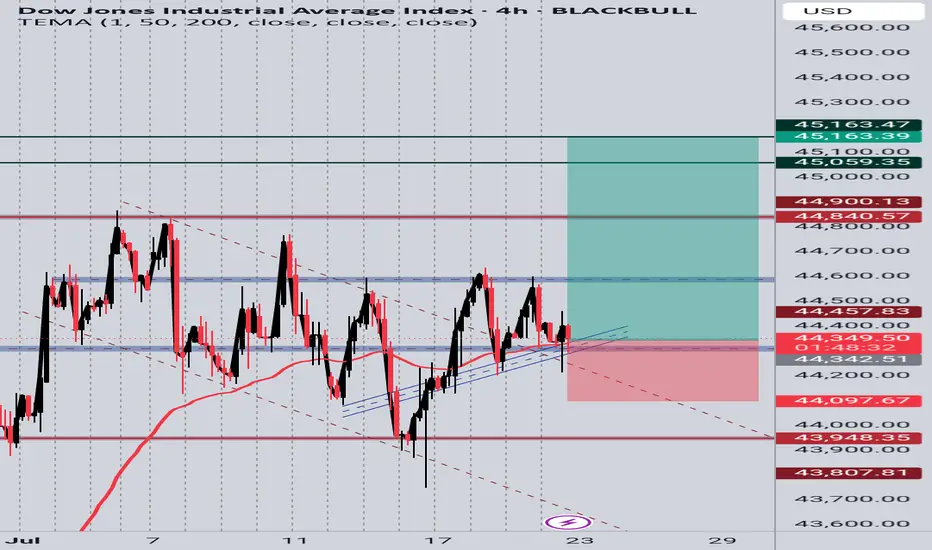
US30 4H Long SetupPrice is respecting a rising trendline and holding above a key support zone. After multiple rejections at the trendline and EMA bounce, current candle shows bullish intent. Targeting previous resistance zones around 45,059 and 45,163. SL placed below the trendline and recent structure low at 44,097. Setup based on structure support, EMA reaction, and potential bullish continuation.
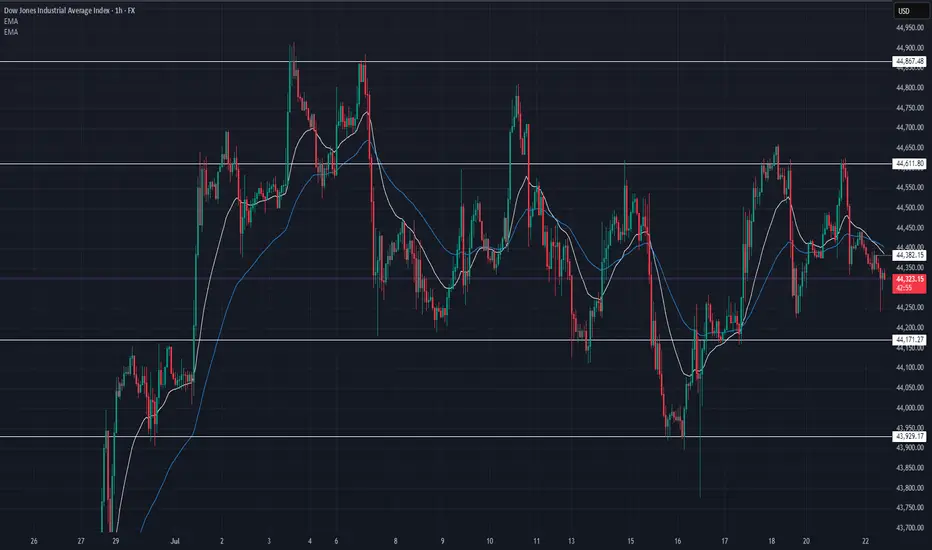
US30 Update – 07/22/2025📍 US30 Update – 07/22/2025
Still trapped in the range chop ⚠️
Price rejected off 44,611 again and is now pulling back toward mid-range. Structure continues to respect key zones, and we now see lower highs forming — early signs of bearish pressure building 🐻
EMA crossover is flipping bearish on the 1H — sellers gaining control short term.
📊 Market Structure:
📉 Lower highs forming below 44,611
📈 Still above demand at 44,171
📉 EMA 9/21 crossover down — bearish tilt
📉 Momentum weak under 44,385
🔑 Key Levels:
🔼 Resistance: 44,611 → 44,867
🔽 Support: 44,171 → 43,929
🧠 Market Bias:
Short-term bearish 🧨
➡️ Clean breakdown of 44,171 = bearish momentum
➡️ Buyers must reclaim 44,385 to shift bias
💡 Trade Scenarios:
📉 Bearish Rejection Play:
Entry: 44,380–44,400
TP1: 44,200
TP2: 44,000
SL: Above 44,430
📈 Demand Bounce (Low-Risk Buy):
Entry: 44,180–44,150
TP1: 44,385
TP2: 44,600
SL: Below 44,100
US30Given the current COT data, technical indicators, and economic factors, the bias for the US30 is bearish. Traders should monitor upcoming economic reports and Federal Reserve announcements for potential shifts in market sentiment.

Possibility of uptrend It is expected that the triangle pattern will form according to the specified direction and then we will see the start of the upward trend. If the index breaks through the support area and consolidates, the continuation of the downward trend is likely.

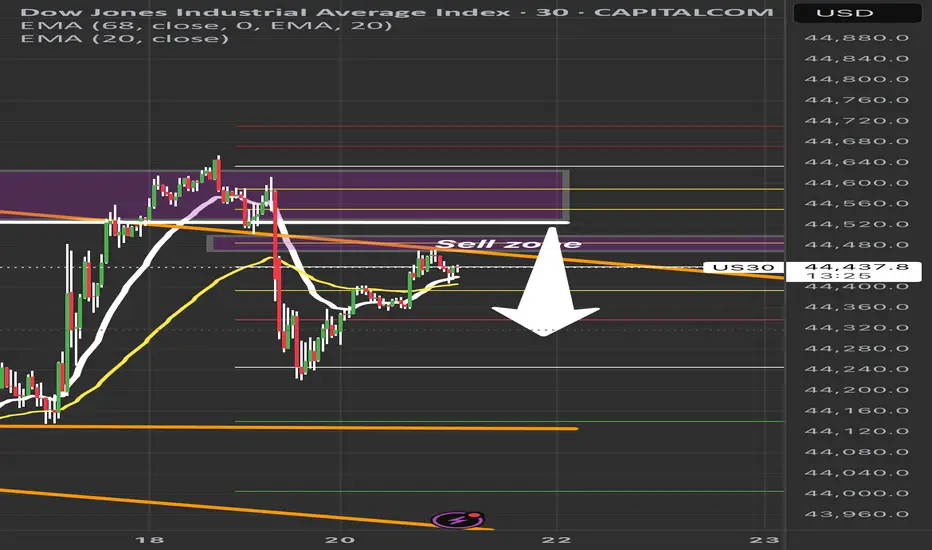
US30 Sell Setup – Watching Key Retracement ZonePrice is pulling back into a key sell zone (44,480–44,550) after a strong bearish move.
✅ Confluences:
• Previous liquidity zone
• 50–61.8% Fib retracement
• EMA rejection overhead
Plan: Waiting for bearish confirmation before short entry.
🎯 Targets:
TP1: 44,300
TP2: 44,150
TP3: 44,000
❌ Invalidation: Break above 44,600.
Patience = Precision. No confirmation, no trade.
#US30 #DowJones #TradingSetup #SmartMoneyConcepts #PriceAction #LiquidityZones #ForexTrading #DayTrading #IndicesTrading #SupplyAndDemand #TechnicalAnalysis #Fibonacci #MarketStructure #ScalpSetup #SwingTrade #RiskManagement #TradingEducation
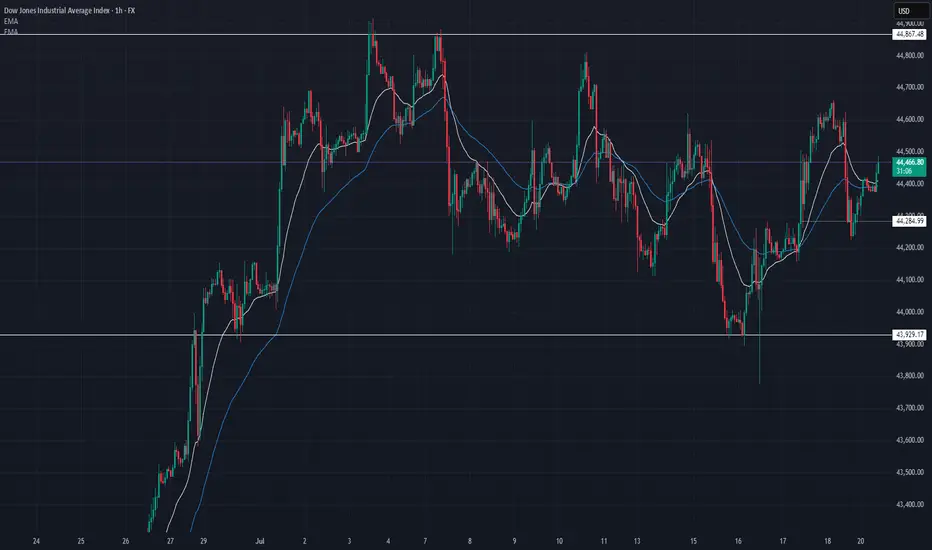
US30 Update – 07/21/2025📍 US30 Update – 07/21/2025
Sideways chop continues on US30 🌀
We’re still range-bound between 44,285 and 44,867, with price currently hovering mid-range around 44,470. Structure remains indecisive — buyers tried to push higher but got faded near the 44,600 level again.
EMA structure is flat on the 1H — confirmation that we’re consolidating.
📊 Market Structure:
🔄 Consolidation Zone: 44,285 → 44,867
📉 Failed to hold above 44,600
📈 Bulls defending 44,285 zone (demand still active)
📊 1H EMAs flat — neutral/slightly bullish
🔑 Key Levels:
🔼 Resistance: 44,600 → 44,867
🔽 Support: 44,285 → 43,929
🧠 Market Bias:
Neutral short term ⚖️
➡️ Clear breakout above 44,867 = trend continuation
⬇️ Breakdown below 44,285 = bearish structure confirmed
💡 Trade Scenarios:
📈 Range Buy (Support Play):
Entry: 44,300–44,285
TP1: 44,500
TP2: 44,700
SL: Below 44,200
📉 Range Sell (Resistance Fade):
Entry: 44,600–44,650
TP1: 44,400
TP2: 44,300
SL: Above 44,700
⚔️ Breakout Setup:
Long above 44,870 (confirmation)
Short below 44,280 with volume
📵 No trade in the middle of the range unless scalp — wait for edges to act.
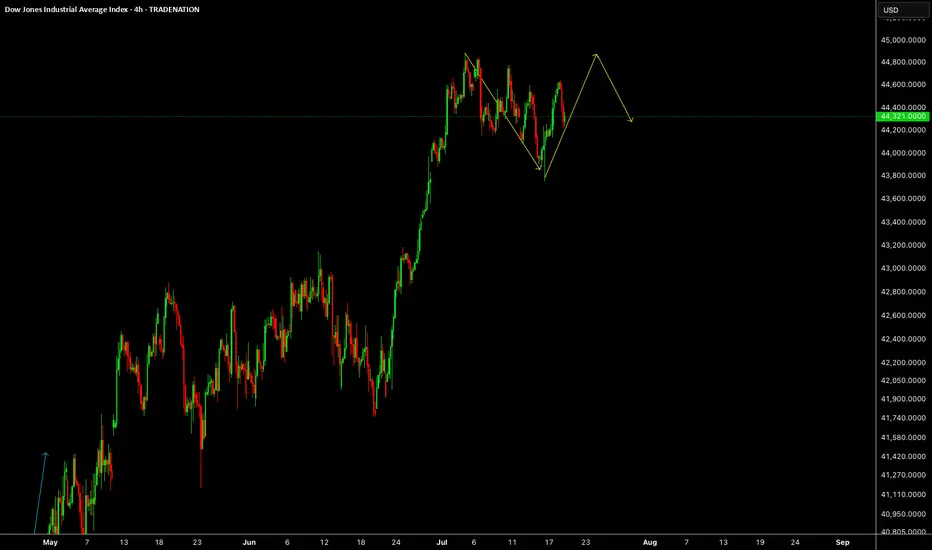
US30 - Pattern & SMA PerspectiveDear Friends in Trading,
How I see it,
Pattern suggests there is room for more upside action.
1) SMA's are weaving - tight state - accumulation
2) As long as price respects the pattern a bullish breakout is likely.
Keynote:
A very healthy bull trend full of liquidity lies beneath this holding pattern
An unforeseen fundamental catalyst may force a correction at any time
I sincerely hope my point of view offers a valued insight.
Thank you for taking the time study my analysis.

US30US30 needs some more correction, this week will be up and down both moves.
Disclosure: We are part of Trade Nation's Influencer program and receive a monthly fee for using their TradingView charts in our analysis.
Dow Jones -> A breakout rally of +40%!🐂Dow Jones ( TVC:DJI ) will create new highs:
🔎Analysis summary:
Since the April lows, the Dow Jones already rallied about +25%. This was simply the expected rejection away from a strong confluence of support. Now, the Dow Jones is sitting at the previous all time highs and about to break out, leading to a massive rally.
📝Levels to watch:
$45.000, $60.000
🙏🏻#LONGTERMVISION
Philip - Swing Trader

US30 - LONGBearish Friday after price hit a key level high. Price will continue to the downside the remainder of today. Expecting a jump back to today's highs come Monday morning.
US30: Move Up Expected! Long!
My dear friends,
Today we will analyse US30 together☺️
The price is near a wide key level
and the pair is approaching a significant decision level of 44,325.14 Therefore, a strong bullish reaction here could determine the next move up.We will watch for a confirmation candle, and then target the next key level of 44,425.56.Recommend Stop-loss is beyond the current level.
❤️Sending you lots of Love and Hugs❤️
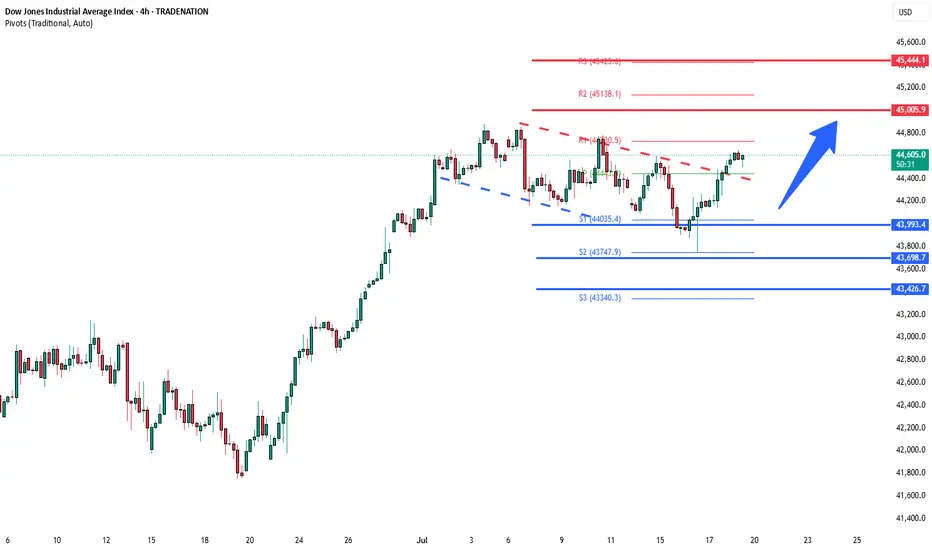
DowJones bullish continuation breakout support at 43990Key Support and Resistance Levels
Resistance Level 1: 45000
Resistance Level 2: 45440
Resistance Level 3: 46000
Support Level 1: 43990
Support Level 2: 43700
Support Level 3: 43420
This communication is for informational purposes only and should not be viewed as any form of recommendation as to a particular course of action or as investment advice. It is not intended as an offer or solicitation for the purchase or sale of any financial instrument or as an official confirmation of any transaction. Opinions, estimates and assumptions expressed herein are made as of the date of this communication and are subject to change without notice. This communication has been prepared based upon information, including market prices, data and other information, believed to be reliable; however, Trade Nation does not warrant its completeness or accuracy. All market prices and market data contained in or attached to this communication are indicative and subject to change without notice.
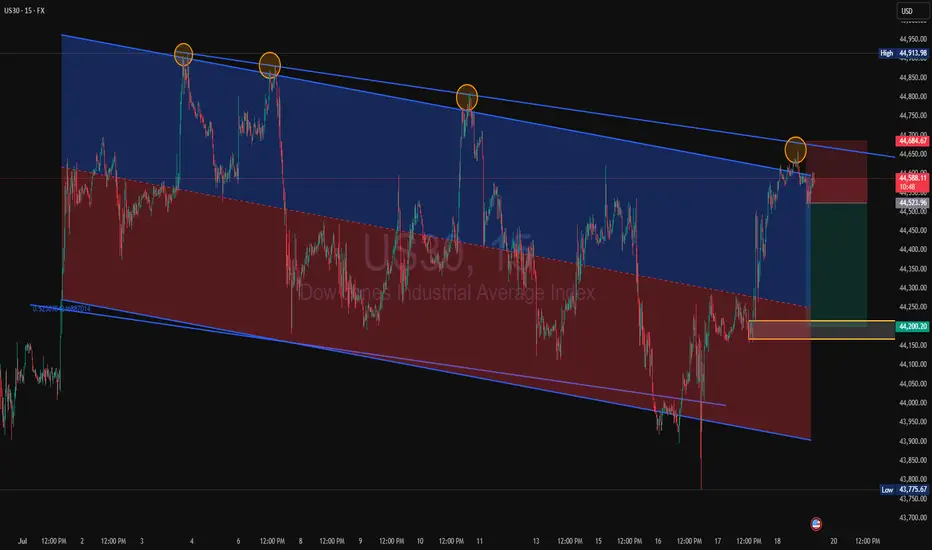
US30 Rejection at Channel Resistance US30 is showing a repeated pattern of rejection at the upper boundary of the descending channel. Price has now tapped this trendline for the fourth time, forming a consistent bearish structure.
Price rejected again at the top of the descending channel (marked by orange circles)
Clear sell setup with stop above the most recent swing high, targeting the lower channel boundary around 44,200, aligning with past demand.
Short below 44,685
Target: 44,200
Stop: Above recent highs near 44,913
Risk/Reward: Favourable if structure holds. If this pattern plays out as before, we can expect another push to the downside within the channel.
A break and retest of the midline could add extra confirmation.
#US30 #DowJones #PriceAction #SellSetup #BearishRejection #ChannelTrading #TechnicalAnalysis
EURUSD & US30 Trade Recaps 18.07.25A long position taken on FX:EURUSD for a breakeven, slightly higher in risk due to the reasons explained in the breakdown. Followed by a long on OANDA:US30USD that resulted in a loss due to the volatility spike that came in from Trump.
Full explanation as to why I executed on these positions and the management plan with both.
Any questions you have just drop them below 👇
