NSDQ100 Bullish breakout retest?Donald Trump escalated trade tensions again, threatening a 35% tariff on Canadian goods shortly after reopening trade talks, and floated doubling global tariffs to 20%. This reinforces his aggressive protectionist stance and puts renewed pressure on allies like Canada and Vietnam, the latter blindsided by a 20% levy. Meanwhile, US-China relations may be entering a critical phase, with a possible Trump-Xi summit hinted at by Marco Rubio during talks in Malaysia.
On the geopolitical front, Trump is signaling a harder line on Russia, previewing a “major statement” and backing expanded sanctions as the US sends more weapons to Ukraine. This raises global uncertainty, especially for energy and defense sectors.
Conclusion for NSDQ100 trading:
Rising trade tensions and geopolitical risks may dampen market sentiment and lead to volatility in tech-heavy Nasdaq stocks, particularly those reliant on global supply chains. While traders have grown numb to tariff talk, the cumulative pressure suggests a downside risk is building. In the short term, maintain a cautious stance—watch for potential pullbacks and heightened intraday volatility as policy clarity remains elusive.
Key Support and Resistance Levels
Resistance Level 1: 22940
Resistance Level 2: 23060
Resistance Level 3: 23180
Support Level 1: 22410
Support Level 2: 22300
Support Level 3: 22130
This communication is for informational purposes only and should not be viewed as any form of recommendation as to a particular course of action or as investment advice. It is not intended as an offer or solicitation for the purchase or sale of any financial instrument or as an official confirmation of any transaction. Opinions, estimates and assumptions expressed herein are made as of the date of this communication and are subject to change without notice. This communication has been prepared based upon information, including market prices, data and other information, believed to be reliable; however, Trade Nation does not warrant its completeness or accuracy. All market prices and market data contained in or attached to this communication are indicative and subject to change without notice.
USTEC trade ideas

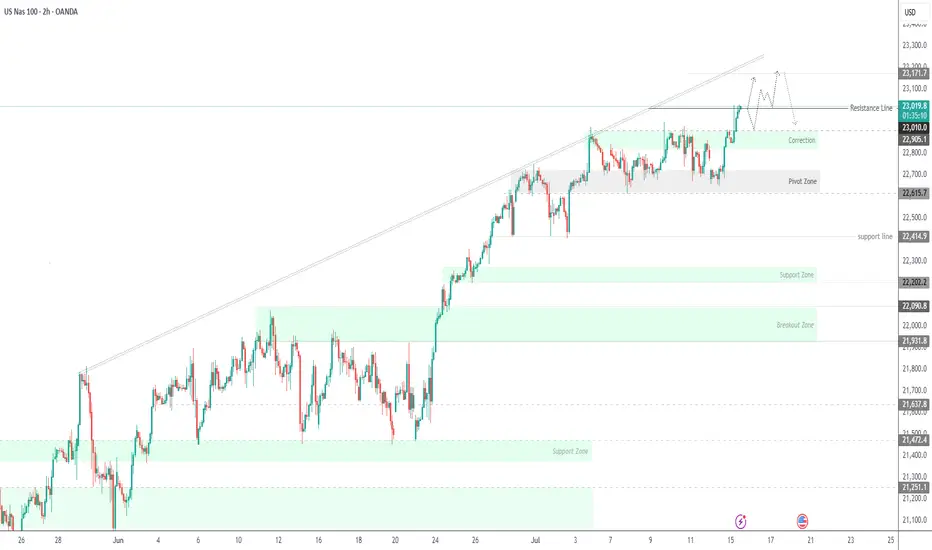
NAS100 Bigger Picture. Uptrend to be resumedLooking at the current structure through the lens of a trend trading approach, what we saw on NAS100 is more than a simple price bounce, it’s a trend continuation trading within a high-volatility environment. As price is approaching a key resistance level, how price is behaving around this dynamic trendline will be key.
This recent retracement and rejection happening near what we can call a demand zone cluster, was confirmed by a beautiful bounce off the support range. And right now price is respecting the upper and lower bounds nicely.
What happens next? Price is showing signs of bullish exhaustion, but the higher-timeframe structure supports a continuation.
My projected target is towards the upper resistance line, that’s my 23,100 zone as shown.

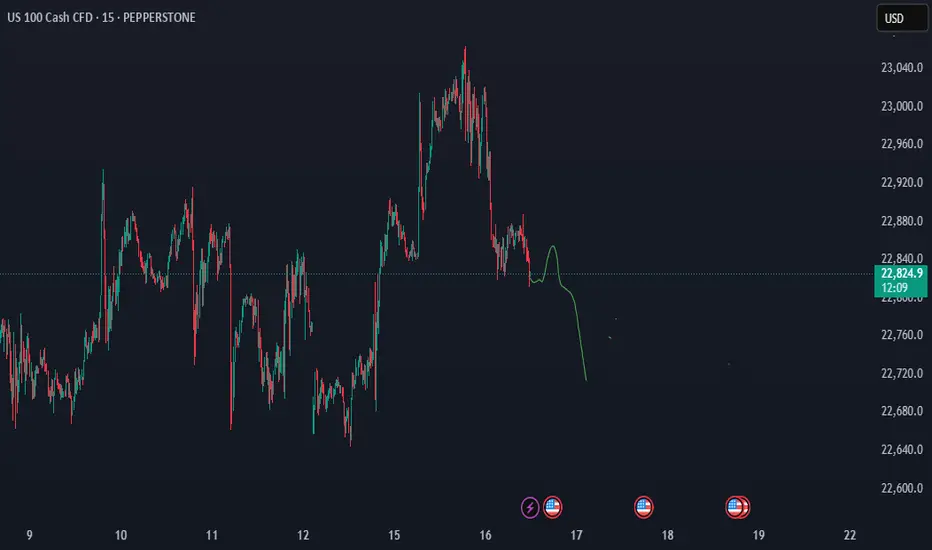
NASDAQ Potential DownsidesHey Traders, in today's trading we are monitoring NAS100 for a selling opportunity around 22,800 zone, NASDAQ is trading in a downtrend and currently is in a correction phase in which it is approaching the trend at 22,800 support and resistance area.
Trade safe, Joe.

NAS100 Setup Locked In — Ride the Drop from the Order Block!Hey Guys,
I'm planning a sell trade on the NAS100 index from a designated order block. Once price reaches the sell zone, the position will be activated.
📍 Trade Details:
- 🟢 Entry Level: 22,869
- 🔴 Stop Loss: 22,930
- 🎯 TP1 – First Target: 22,839
- 🎯 TP2 – Second Target: 22,794
- 🎯 TP3 – Final Target: 22,671
📐 Risk-to-Reward Ratio: 3.24
Your likes and support are what keep me motivated to share these analyses consistently.
Huge thanks to everyone who shows love and appreciation! 🙏

One last squeeze and NAS100 could explode into the next rallyThe NAS100 is currently coiling within a tight consolidation range, showing signs of tension building up. After a strong push upward, price has been moving sideways in a narrowing structure. This build-up around the high, a compression of buyers and sellers in a low-volatility squeeze could be an indication that we could use. This kind of price action typically signals that buyers are gaining control, squeezing out sellers with each dip.
The lack of deep pullbacks combined with increasingly shallow sell-offs shows fading bearish momentum. Which is often typical during a buildup phase before a breakout. If buyers can push price above with a strong close, it could trigger breakout momentum and lead to a continuation of the larger bullish trend.
Ideally, if price reacts positively and forms bullish confirmation, it would set up a solid continuation entry, with upside potential toward the next target of 23.400.
Until then, bulls are watching closely for signs of commitment. The breakout is yet to be confirmed, but the squeeze is on, and the pressure is building.
What will happen next?
Just sharing my thoughts for the charts, this isn’t financial advice. Always confirm your setups and manage your risk properly.
Disclosure: I am part of Trade Nation's Influencer program and receive a monthly fee for using their TradingView charts in my analysis.

NASDAQ possible Down Reverse Zone For Short Term According to the current market situation, the strength of sellers getting little bit stronger as yesterday news makes USD stronger. Let's see how things going on and waiting for a one up pullback for make day trading sell entry
25-07-03 NDX 22867 - Recovery done/Correction aheadImpulsive recovery with nice 1 to 5 structure.
Expect maybe last 3-5% upward, then correction down to 20'600.

NASDAQ Is looking for a massive break-out to 24000!Nasdaq (NDX) is most likely taking advantage of the 4H MA50 (blue trend-line) as a Support and after hitting it, it appears that the price will look for a way above the Parabola.
This might be similar to what took place after the May 07 test of the 4H MA50. The price broke above that parabolic pattern and peaked on the 2.0 Fibonacci extension. As a result, we are looking for 24000 as a potential Target in the next 2 weeks.
-------------------------------------------------------------------------------
** Please LIKE 👍, FOLLOW ✅, SHARE 🙌 and COMMENT ✍ if you enjoy this idea! Also share your ideas and charts in the comments section below! This is best way to keep it relevant, support us, keep the content here free and allow the idea to reach as many people as possible. **
-------------------------------------------------------------------------------
Disclosure: I am part of Trade Nation's Influencer program and receive a monthly fee for using their TradingView charts in my analysis.
💸💸💸💸💸💸
👇 👇 👇 👇 👇 👇

US100 Strong Bullish Breakout!
HI,Traders !
#US100 is trading in a
Strong uptrend and the
made a bullish breakout
Of the key horizontal level
Of 22879.1 so we are
Bullish biased and we will
Be expecting a further
Bullish move up !
Comment and subscribe to help us grow !

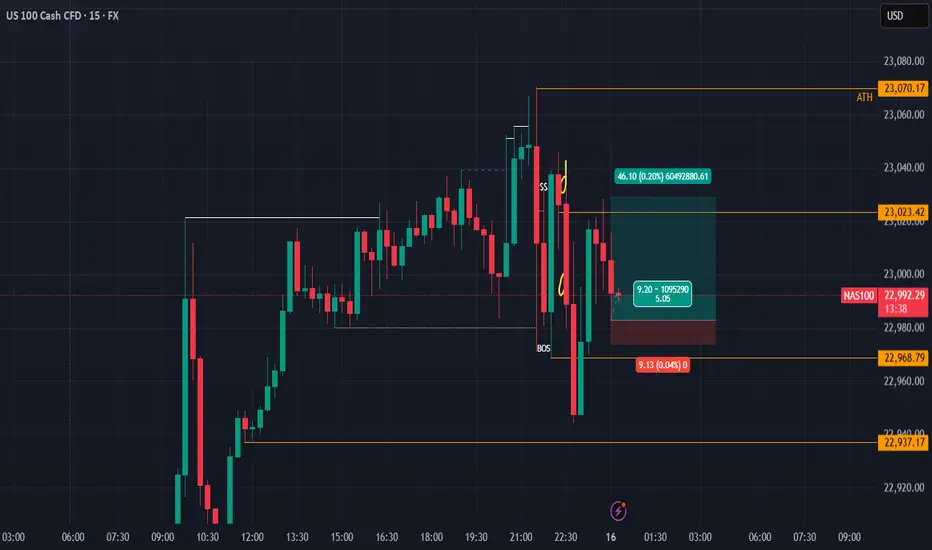
NQ Buy within range The overall trend is ranging, but the price recently created a new ATH and now it seem to be grabbing liquidity. With that, we can expect the price to continue pushing up to at least grab the liquidity above 23029.47.
NASDAQ100 Hits Target at 23170 – Watch for Breakout or PullbackNASDAQ100 Tests ATH – Key Decision Zone at 23170
New ATH Achieved:
NASDAQ100 recorded a new All-Time High (ATH), hitting our target at 23170 precisely as projected.
Currently, price is consolidating below 23170. Sustained rejection at this level could trigger a short-term bearish pullback toward 23010. A deeper correction may extend to 22900 or even 22815.
However, a clean breakout above 23170 would confirm bullish continuation, with the next target at 23350.
Key Levels
• Pivot: 23170
• Resistance: 23250 / 23350
• Support: 23010 / 22900 / 22815
Outlook:
• Bullish above 23170
• Bearish below 23170 (short-term pullback zone)

Nasdaq-100 H4 | Swing-low support at 23.6% Fibonacci retracementThe Nasdaq-100 (NAS100) is falling towards a swing-low support and could potentially bounce off this level to climb higher.
Buy entry is at 22,509.40 which is a swing-low support that aligns closely with the 23.6% Fibonacci retracement.
Stop loss is at 22,250.00 which is a level that lies underneath a pullback support and the 38.2% Fibonacci retracement.
Take profit is at 22,921.84 which is a multi-swing-high resistance.
High Risk Investment Warning
Trading Forex/CFDs on margin carries a high level of risk and may not be suitable for all investors. Leverage can work against you.
Stratos Markets Limited (tradu.com ):
CFDs are complex instruments and come with a high risk of losing money rapidly due to leverage. 63% of retail investor accounts lose money when trading CFDs with this provider. You should consider whether you understand how CFDs work and whether you can afford to take the high risk of losing your money.
Stratos Europe Ltd (tradu.com ):
CFDs are complex instruments and come with a high risk of losing money rapidly due to leverage. 63% of retail investor accounts lose money when trading CFDs with this provider. You should consider whether you understand how CFDs work and whether you can afford to take the high risk of losing your money.
Stratos Global LLC (tradu.com ):
Losses can exceed deposits.
Please be advised that the information presented on TradingView is provided to Tradu (‘Company’, ‘we’) by a third-party provider (‘TFA Global Pte Ltd’). Please be reminded that you are solely responsible for the trading decisions on your account. There is a very high degree of risk involved in trading. Any information and/or content is intended entirely for research, educational and informational purposes only and does not constitute investment or consultation advice or investment strategy. The information is not tailored to the investment needs of any specific person and therefore does not involve a consideration of any of the investment objectives, financial situation or needs of any viewer that may receive it. Kindly also note that past performance is not a reliable indicator of future results. Actual results may differ materially from those anticipated in forward-looking or past performance statements. We assume no liability as to the accuracy or completeness of any of the information and/or content provided herein and the Company cannot be held responsible for any omission, mistake nor for any loss or damage including without limitation to any loss of profit which may arise from reliance on any information supplied by TFA Global Pte Ltd.
The speaker(s) is neither an employee, agent nor representative of Tradu and is therefore acting independently. The opinions given are their own, constitute general market commentary, and do not constitute the opinion or advice of Tradu or any form of personal or investment advice. Tradu neither endorses nor guarantees offerings of third-party speakers, nor is Tradu responsible for the content, veracity or opinions of third-party speakers, presenters or participants.

NAS100 Is Very Bullish! Long!
Take a look at our analysis for NAS100.
Time Frame: 12h
Current Trend: Bullish
Sentiment: Oversold (based on 7-period RSI)
Forecast: Bullish
The market is on a crucial zone of demand 23,006.9.
The oversold market condition in a combination with key structure gives us a relatively strong bullish signal with goal 23,667.5 level.
P.S
Overbought describes a period of time where there has been a significant and consistent upward move in price over a period of time without much pullback.
Disclosure: I am part of Trade Nation's Influencer program and receive a monthly fee for using their TradingView charts in my analysis.
Like and subscribe and comment my ideas if you enjoy them!

US100: The only risk remains Trump with his tariffs.US100: The only risk remains Trump with his tariffs.
US100 is in a strong uptrend and the chances of it rising are still high.
The price has already found a strong support near 22600 and I think it is preparing to start an uptrend soon.
The only risk for the Indices is related to Trump and his tariffs. This is the only threat I see at the moment.
Key targets: 22875 ; 22997; 23075
You may find more details in the chart!
Thank you and Good Luck!
PS: Please support with a like or comment if you find this analysis useful for your trading day

NASDAQ at Risk – Tariffs Pressure Tech IndexUSNAS100 – Market Outlook
The index is currently in a sensitive zone, heavily influenced by ongoing tariff tensions. If the current geopolitical pressure continues, it may fuel bearish momentum across the tech-heavy index.
To regain a bullish outlook, we need to see signs of negotiation or de-escalation, which could stabilize the price and lead it toward 23010 and 23170.
However, as of today, the market appears to be setting up for a correction, potentially dipping to 22815, followed by a deeper bearish move targeting 22420.
Support Levels: 22615 – 22420
Resistance Levels: 22905 – 23010

NAS100Short-Term Outlook for NAS100 (as of mid-July 2025):
Recent Trend:
• The NAS100 has been in a strong bullish trend throughout much of 2025, driven by:
• Big tech earnings growth (e.g., Apple, Nvidia, Microsoft, Meta).
• AI and chip sector boom.
• Fed’s pause (or even rate cuts) in interest rates.

[LONG] NASDAQ still very bullishFundamentals for bias.
Technicals for entry.
Daily support at 22,600
Target ATH at 23,050
Im buying more @ 22,730
higher high higher low higher high higher low = bullish.

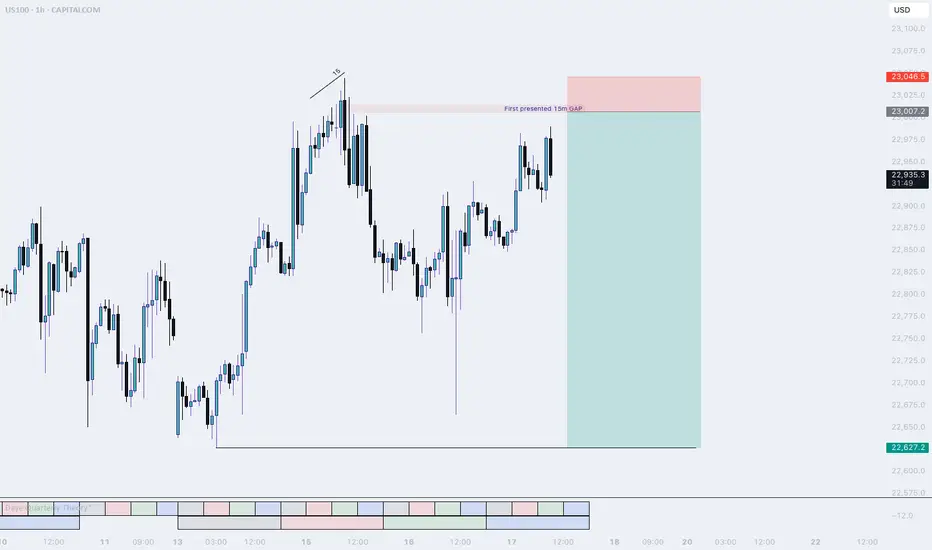
NQ, Short setupJust before market Open price dropped lower, I expect price to travel back up into the 15 m Gap and then sell off. This is the only setup I am interested in today.
The 15m level will be a resistance level for price. This level is derived from the last reversal. Since NQ was lagging, i expect price to use his level to squeeze the shorts out and start a new down trend.
If this does not happen and the highs get taken out, I will be flat today
Goodluck, Good trading.
F
US100 (Nasdaq 100) - Future Outlook (as of mid-July 2025)The US100, which is heavily concentrated in technology and growth companies, has been a significant driver of overall market performance in recent times. Its future trajectory is intricately linked to a combination of macroeconomic trends, corporate earnings, and evolving technological narratives.
Key Factors Shaping the Outlook:
Monetary Policy and Inflation Dynamics:
Cooling Inflation: If inflation continues to moderate (as indicated by CPI, PCE, and other economic data), central banks, particularly the U.S. Federal Reserve, will have more flexibility to consider easing monetary policy.
Interest Rate Expectations: Lower interest rates are generally a boon for growth stocks. They reduce the cost of borrowing for companies and increase the present value of their future earnings, which makes their (often higher) valuations more palatable. Conversely, any resurgence in inflation that forces a "higher for longer" interest rate stance could put significant downward pressure on the US100. As of mid-2025, the market has largely priced in the expectation of potential rate cuts later in 2025 or early 2026, but this remains highly data-dependent and subject to change with each new economic report.
C orporate Earnings and AI Enthusiasm:
Tech Earnings Season: The performance of the major tech titans within the Nasdaq 100 (e.g., Apple, Microsoft, Amazon, Google, Nvidia, Meta, Tesla) during their quarterly earnings reports will be critical. Continued strong earnings beats, particularly from companies that are leading the charge in Artificial Intelligence (AI), will reinforce investor confidence and support higher valuations.
Artificial Intelligence (AI) Narrative: The intense excitement and significant investment surrounding AI remain a powerful tailwind for the US100. Companies demonstrating clear pathways to monetize AI, or those establishing dominant positions in AI infrastructure and applications, are likely to continue seeing robust performance. However, any signs of the AI narrative losing steam, or a perception of an AI "bubble," could trigger profit-taking or a broader market correction.
Economic Growth and Consumer Behavior:
U.S. Economic Health: A resilient U.S. economy, characterized by healthy GDP growth and a strong labor market, provides a conducive environment for corporate revenues. A "soft landing" scenario (where inflation is tamed without triggering a recession) is the most favorable outcome for the US100.
Consumer Spending: Strong consumer confidence and sustained spending directly benefit sectors like e-commerce, software services, and consumer electronics, which are heavily represented in the Nasdaq 100.
Valuation Considerations:
While many Nasdaq 100 companies have delivered impressive earnings growth, their valuations (e.g., P/E ratios) are, for some, elevated compared to historical averages. This implies that there might be less margin for error in future earnings reports or unexpected shifts in the economic landscape. A "valuation reset" could occur if growth projections fail to materialize or if interest rates remain higher than currently anticipated.
Geopolitical and Global Factors:
Global Trade & Geopolitics: Ongoing global trade dynamics, geopolitical tensions (e.g., US-China relations, regional conflicts), and potential supply chain disruptions can introduce unforeseen volatility and impact global economic growth, which, in turn, affects the predominantly international-facing tech sector.
Overall Future Outlook (from a mid-July 2025 perspective):
The US100's future outlook appears cautiously optimistic, primarily driven by the enduring strength of underlying technology trends and the transformative potential of AI. The index has demonstrated remarkable resilience and continues to be favored by growth-oriented investors.
Upside Potential: Could be fueled by sustained strong earnings from its tech giants, especially those leading in AI, coupled with clear indications of forthcoming interest rate cuts.
Downside Risks: The index remains highly susceptible to shifts in interest rate expectations (e.g., if inflation proves stickier than anticipated), any disappointments in high-profile tech earnings, or a broader economic downturn. Given its concentration in high-growth, high-beta stocks, the US100 is prone to more significant fluctuations in both upward and downward market moves compared to broader, more diversified indices.
Investors and traders will be closely monitoring key economic data (inflation, employment), central bank communications, and the performance of bellwether tech companies for crucial clues about the index's direction.
⚠️ Disclaimer: This post is educational content and does not constitute investment advice, financial advice, or trading recommendations. The views expressed here are based on technical analysis and are shared solely for informational purposes. The stock market is subject to risks, including capital loss, and readers should exercise due diligence before investing. We do not take responsibility for decisions made based on this content. Consult a certified financial advisor for personalized guidance
For those interested in further developing their trading skills based on these types of analyses, consider exploring the mentoring program offered by Shunya Trade.
I welcome your feedback on this analysis, as it will inform and enhance my future work

BuyRejection Level
Daily Volume
Market Structure Shift
US Session
Trend Line Break
Untapped Order Point

USNAS100 | Consolidation 23010 - 22900, Bearish or Not Yet...USNAS100: Cautious Consolidation as Powell Uncertainty Lingers
Following political noise around Fed Chair Powell — with Trump admitting he floated the idea of replacing him — tech markets have entered a cautious consolidation. While no immediate action was taken, the underlying uncertainty continues to weigh on sentiment, especially in rate-sensitive sectors like tech.
Technically: Consolidation Before the Break
The price is currently consolidating between 22900 and 23010.
A confirmed 1H close below 22900 would signal the start of a bearish trend, targeting 22700 and 22615.
Conversely, a close above 23010 would open the path toward a new all-time high (ATH) at 23170.
Key Levels:
Support: 22700, 22615
Resistance: 23010, 23170

Nas100USD (LONG)
Price had been respecting the resistance trendline for months/years.
USD is at it support level which means indicies will go short
Perfect correlation.

USNAS100 Outlook – CPI Data to Confirm Breakout or PullbackUSNAS100 – Bullish Momentum Holds Ahead of CPI
USNAS100 continues to show strong bullish momentum, trading above 22,905 and recently printing a new all-time high (ATH).
As long as price remains above this level, the next upside target is 23,170, followed by 23,300.
Market Focus – CPI Data Today:
• Expected: 2.6%
• Below 2.6% → bullish reaction likely
• Above 2.6% → bearish pressure expected
• Exactly 2.6% → could trigger a short-term bearish pullback
Key Risk Level:
A confirmed break below 22,905 would signal weakness and open the door for a correction toward 22,615.