Recession post #9778Trial and error describes my past calls considering there was resistance and pullbacks on the daily tf but this time I'm certain
abso-tut-ely
Posi-tively
Demise
Trumps attempts have played out like a witty protagonist of a finance suspense thriller but that has nothing to do with the historical alignments of boom and bust systems. I think he intended to crash markets so it could recover but I'm not convinced this tank is greater than this
USTEC trade ideas

US100 - Bullish Momentum Favors Upside ContinuationThe US Tech 100 is displaying strong bullish momentum after successfully breaking above the critical resistance level at 20,659.8, which had previously acted as a significant barrier. Currently trading at 21,316 the index has demonstrated impressive upward trajectory following what appears to be a healthy consolidation phase around the key resistance-turned-support zone. The technical setup strongly favors continuation to the upside as the higher probability scenario, with the breakout above 20,659.8 potentially opening the door for further gains toward higher resistance levels. However, prudent risk management suggests taking this rally piece by piece, monitoring how price action develops at each significant level while watching for any signs of exhaustion or pullback that might offer better entry opportunities. The bullish bias remains intact as long as the index maintains its position above the former resistance level, which should now serve as dynamic support for any potential retracements.
Disclosure: I am part of Trade Nation's Influencer program and receive a monthly fee for using their TradingView charts in my analysis.

USTECUSTEC price is near the resistance zone 21776-22139. If the price cannot break through the 22139 level, it is expected that the price will drop. Consider selling the red zone.
🔥Trading futures, forex, CFDs and stocks carries a risk of loss.
Please consider carefully whether such trading is suitable for you.
>>GooD Luck 😊
❤️ Like and subscribe to never miss a new idea!

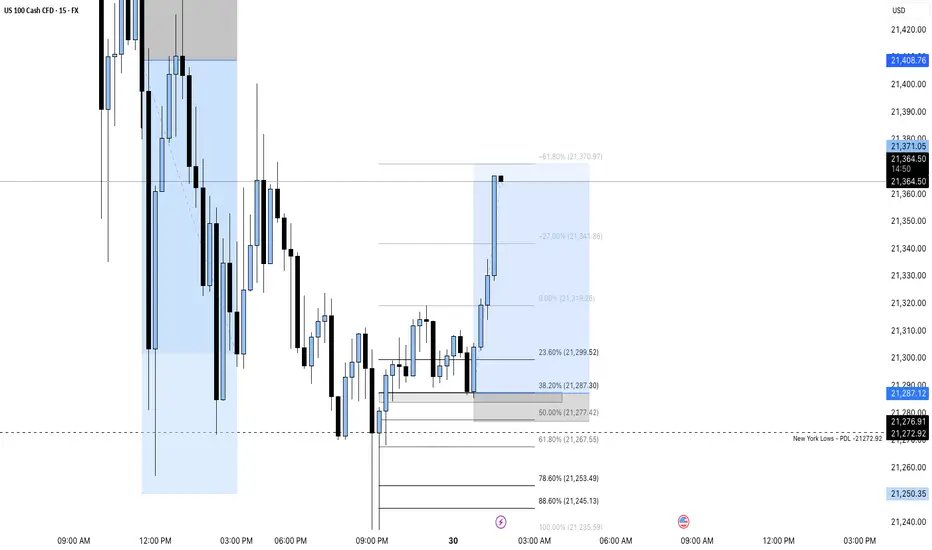
NAS100 4H | Fibonacci Bounce or Break? Key Trendline Test Incomi📈 Description:
Price is currently testing a key ascending trendline on the 4H, sitting just below the 38.2% Fib retracement after rejecting near the 0% level. I’m watching this area closely for either:
✅ A bullish bounce from the 38.2%–50% zone with confluence from EMA 20 and trendline support — targeting 0% then -27% extensions (around 21,750 to 22,200),
or
❌ A clean break and close below the trendline + 61.8% level that could shift short bias toward deeper Fib zones like 78.6% or even 100%.
Indicators Used:
• EMA 20 / EMA 68 for dynamic S/R
• Fibonacci retracement (swing low to recent high)
• Trendline (4H structure support)
🧠 I’ll wait for clear structure before entering — no early entries here. Looking for a strong engulfing candle, MA crossover, or lower-timeframe breakout confirmation depending on the direction.
📍Will update if we get confluence on the 15min/1hr to support entry.

NAS100...Ever The Bullish Instrument...Part 38The last ATH was signaled on February 25, 2025 at exactly 3:00 am EST...(Back Test and see the M1 chart)
Since that time the market has started to make LH's LL on the smaller timeframes in order to create the next HL on the largest active timeframe.
For almost 2 months, the market entered into a deep and hard retracement with many doomsday fanatics aiming at becoming the next phenomenon in trading predictions, trying to suggest that this is the beginning of the greatest drop the NAS100 and other instruments will ever see.
I have always maintained and I stand even more firmly on the fact that any sells you see in the markets are only temporary retracements toward another HL and that the market has always and will only make HL's to HH's.
Fast forward to April 6, 2025 at 7:10 (Back Test and see the M1 chart) pm the market hit it's largest HL point. Since that time...the market has started to make HL's to HH's on your small to medium timeframes while still keeping the largest HL created on the monthly intact.
The H4 time frame you will see is now signaling the first round of HL's to HH's a solid confirmation that the market is finally breaking out of it's retracement phase and back to resume it's usual trend.
Another key factor to note is that last weeks highest point is only approximately 4,000 pips from the ATH and if you have been tracking the NAS100 you should have noticed that every week that number is getting smaller and smaller and it will only be a matter of time for that to be broken again.
With that being said, my strategy still remains the same...
1. Enter on my largest HL and trade to my HH's
2. In the event that there is still consolidation in the markets with LH's being created on the
medium timeframes, I simply TP and wait for another setup.
Even with Friday's frenzy created by emotional traders reacting Trump and his circus show, the markets still held their own and still closed above the low of every single week since April 6, 2025.
What this means is that the ATH will be broken very soon and it just requires patience and a dedication to the strategy to ensure that it is followed to the last detail.
I say without apology...
All highs on the NAS100 are guaranteed to be broken
The NAS100 trades only HL's to HH's and that is a guaranteed fact
So trade wisely...
Trade smartly...
Manage your risk...
Happy Trading...
#oneauberstrategy
#aubersystem
#whywewait
#patience
#zigzagtheory

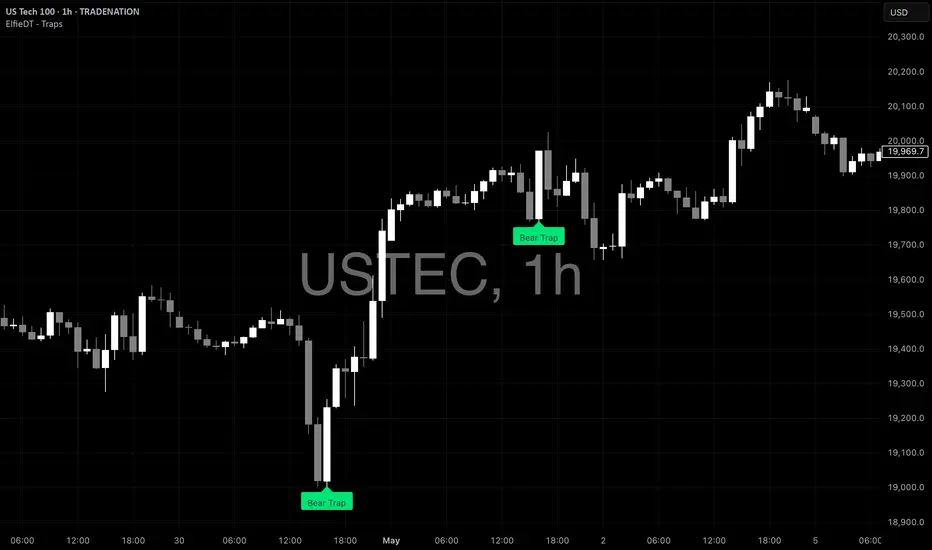
Make some moneyHere are some more examples….
Like and follow for more - we have 2 indicators you guys can use now!
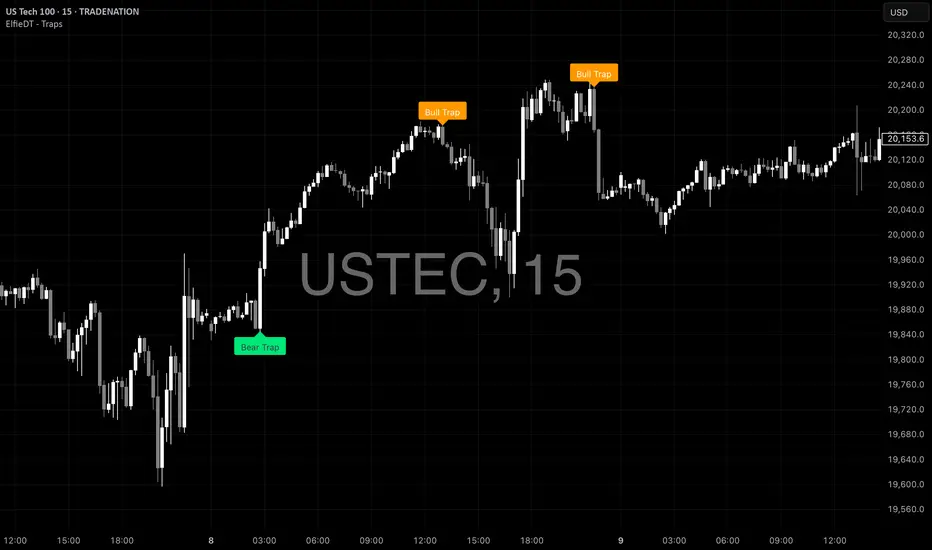
The Traps Once again - some great examples of traps candles….
Add the idicator and see them even on the smaller timeframes.
TRAPS. - Use themHere is an example of a trap candle identified by the indicator as just share with you guys.
Trust you can make it work for you!

Are we expecting lower prices on NAS100?!Change in order flow from offering higher prices to sellers to low prices to buyers ;)

Short US100Think we see a move up to the 0.786 fib level from the recent highs with a rejection down further if more blocks or doubt is cast on the new trade deals and tariffs.
TP would be the weekly lows
Bearish thoughts
- The fundamentals of the tariffs deals are getting challenged
- A bit more aggressiveness from china and we might see a move down
- Daily MACD is pointing down suggesting downward pressure which we are seeing on hourly chart
Bullish structure remains on the 4hr chart

Nasdaq breaks uptrendline and consolidating in narrow zoneNasdaq breaks uptrendline and consolidating in narrow zone

H&S Watch! Pullback Toward 18.4K Likely, POC at 15K is Critical!This chart presents a comprehensive technical and macro assessment of the NASDAQ 100 (US100) using the daily timeframe. The focal point is a developing Head & Shoulders (H&S) pattern, currently unconfirmed, but well-formed with strong structural and momentum confluence.
🧠 Thought Process & Structure
The chart reveals a potential H&S pattern with the right shoulder forming just below 22,200. While the neckline at 18,400 has not broken yet, several signals support the idea of a short-term pullback:
Bearish RSI divergence from the recent high
Stochastic crossovers on both daily and weekly timeframes from overbought levels
A large unfilled gap near 18,400 that is likely to act as a magnet
Rather than predicting an immediate collapse, this analysis takes a probability-weighted approach and lays out both bullish and bearish outcomes clearly.
📉 Current Expectation: Pullback Toward 18,400
A move toward 18,400 is the base case. This level represents:
The neckline of the H&S structure
The location of Gap Fill Target 2
A prior demand zone from April 2025
A bounce here would not invalidate the pattern but could delay its confirmation. It’s also a valid level for a short-term long trade setup if buyers defend it strongly.
⚠️ Break Below 18,400: POC Zone Becomes Critical
Should 18,400 break decisively, the market could test the Point of Control (POC) around 15,000. This zone:
Has the highest historical volume concentration
Aligns with the 0.618 Fibonacci retracement
Marks the new measured move target of the Head & Shoulders pattern
In short, 15,000 becomes the most critical structural and psychological support. If it fails, deeper risk reopens.
🔻 Deeper Move Scenarios (Now Less Likely)
Previous versions of this chart targeted 10,500. That level is now considered outside the measured move and only becomes viable if:
15,000 fails to hold
Macro conditions deteriorate sharply (e.g., inflation remains sticky, Fed turns hawkish, or recession triggers a risk-off rotation)
At this time, such an extended move is low probability.
📈 Bullish Invalidation
A breakout above 22,200 with strong volume would invalidate the entire bearish pattern. This would suggest bullish continuation and open the door to 24,000 and beyond. This scenario is also plotted on the chart and clearly labeled.
🧭 Trading Plan
Monitor for rejection or bounce at 18,400
If it holds, long opportunity may develop
If it fails, prepare for POC test at 15,000
Only consider deeper targets if breakdown volume is strong
Invalidate bearish outlook if price closes decisively above 22,200
📅 Macro Events to Watch (June–July 2025)
June 6 – Non-Farm Payrolls (NFP)
June 11 – CPI Report (May)
June 17–18 – FOMC Meeting
June 26 – Final Q1 GDP
June 27 – PCE Inflation
July 3 – June Employment Report
July 15 – June CPI
July 30 – FOMC Meeting #5 & Q2 GDP Advance Estimate
These events could act as triggers for either confirming or invalidating the current technical setup.
✅ Summary
This is a developing setup — not a confirmed breakdown. The current expectation is a pullback toward 18,400, with a potential bounce. If that support fails, the 15,000 POC becomes the key level to watch. The measured move of the H&S pattern now targets 15,000 — not 10,500. Deeper downside should only be considered if strong macro or volume-based catalysts emerge.
This approach allows for flexibility, clarity, and trade planning without bias. Let the chart prove itself — and be ready either way.

NAS100, "TACO trade"After being provoked by Media Trump needs to prove "He Ain't Chicken" (TACO trade).
Expect Choppy correction lower, not "NICE". There's a lesson here, he is the PREZ be nice.

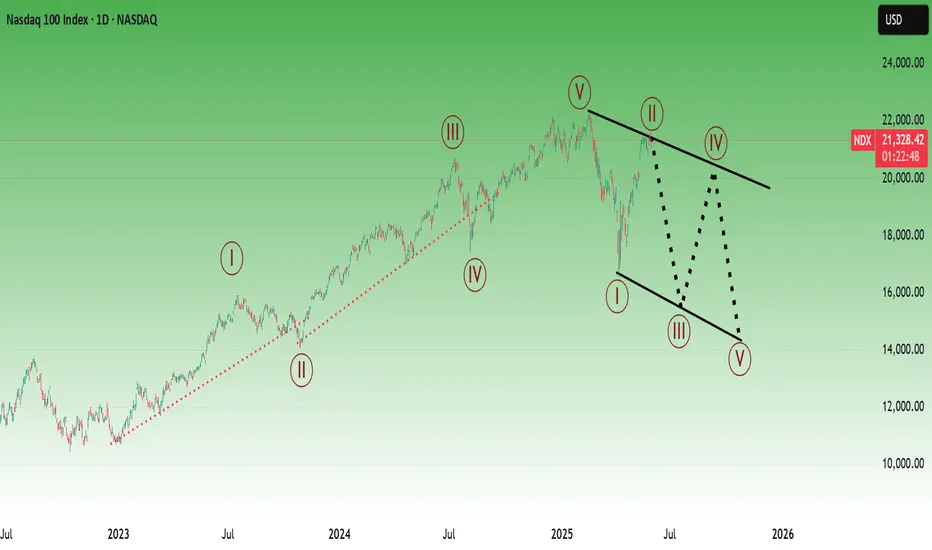
Nasdaq RoadmapTo me the view is pretty clear.
* The purpose of my graphic drawings is purely educational.
* What i write here is not an investment advice. Please do your own research before investing in any asset.
* Never take my personal opinions as investment advice, you may lose your money.
NAS100 BEARISH FOR 35,532 TICKS1. Understanding the Target (35,532 Ticks)
1 tick in NAS100 (CFD/Futures) typically represents 0.25 index points (varies by broker).
35,532 ticks = 35,532 × 0.25 = 8,883 points.
This suggests a long-term bullish outlook if starting from current levels (~18,000-19,000).
2. Key Analysis for NAS100 Forecast
Trend: NAS100 is strongly influenced by tech stocks (AAPL, MSFT, NVDA, etc.) and Fed policy.
Support Levels:
Major support at 18,000-18,500 (2024 consolidation zone).
Resistance Levels:
19,500-20,000 (ATH zone).
21,000-22,000 (next psychological barrier).
3. Take Profit (TP) Strategy
If entering a long position (assuming bullish trend continuation):
Short-term TP: 19,500 (scalping).
Medium-term TP: 20,500-21,000 (swing trade).
Long-term TP (35,532 ticks): ~26,883 (if starting from 18,000).
If entering a short position (unlikely given bullish bias):
TP at key supports (17,500 or lower).
4. Risk Management
Use stop-loss (SL) below key support (e.g., 17,800 for longs).
Position sizing: Risk ≤1-2% per trade.
5. Conclusion
Bullish Case: If NAS100 breaks 20,000, the 35,532-tick (8,883-point) target could be possible in a strong bull run.
Bearish Case: Unlikely unless major crash (Fed tightening/geopolitical crisis).

NASDAQ Markup- Not in the Trade, But the Lesson's ClearDidn’t take this one—not trading NASDAQ right now—but I still mapped it out from the 30M perspective just to stay sharp.
4H gave bullish intent after breaking the major macro LH, so I followed the flow.
Saw a clean 30M inducement sweep, price then mitigated internal structure OB, and I marked exactly where I would’ve entered with LTF confirmation.
Didn’t trade it, but the logic’s there—and if you’ve been watching… you already know what it’s doing now. 🧠📈
Every setup teaches something.
– Inducement King
Bless Trading!

nasdaq : waiting for take the sell stopsThere’s an FVG on the 4H timeframe in Nasdaq,
which indicates strong momentum—likely aiming to hunt some lows.
If the price takes out the specific low I’ve marked,
I’ll watch how the candles react around that area.
If the reaction isn’t strong,
then I’ll start considering a bullish scenario
and look for a potential long setup.

NSDQ100 INTRADAY at pivotal level ?Tariffs & Trade:
The Trump administration is exploring ways to push through import tariffs, possibly including a temporary 15% tariff for 150 days.
A federal appeals court has paused a suspension of the tariffs for now.
Markets:
US stocks are holding up well. The S&P 500 is on track for its best May since 1990.
However, June may be weaker, and futures suggest a quieter trading day ahead.
Federal Reserve & Tax Concerns:
President Trump urged Fed Chair Jerome Powell to cut interest rates in a recent meeting.
Wall Street is uneasy about a tax measure in Trump’s bill that may increase taxes on foreign investors in US assets.
Europe:
The European Central Bank is expected to cut interest rates next week and again in September, possibly settling at 1.75% until the end of 2026.
Bank of England Governor Andrew Bailey pushed for a stronger EU trade deal and emphasized a slow and cautious approach to rate cuts.
Geopolitics:
Russia hasn’t provided a peace talk agenda to Ukraine or its allies.
Hamas is reviewing a US-backed ceasefire plan but says it doesn’t yet meet its demands.
Key Support and Resistance Levels
Resistance Level 1: 21850
Resistance Level 2: 22050
Resistance Level 3: 22200
Support Level 1: 21000
Support Level 2: 20770
Support Level 3: 20560
This communication is for informational purposes only and should not be viewed as any form of recommendation as to a particular course of action or as investment advice. It is not intended as an offer or solicitation for the purchase or sale of any financial instrument or as an official confirmation of any transaction. Opinions, estimates and assumptions expressed herein are made as of the date of this communication and are subject to change without notice. This communication has been prepared based upon information, including market prices, data and other information, believed to be reliable; however, Trade Nation does not warrant its completeness or accuracy. All market prices and market data contained in or attached to this communication are indicative and subject to change without notice.

Buy Scalp ideaWe can see that PD NY low swept by Asia and BOS confirmed with London & Asian high break
The Fib on a 15min OB, with confirmation of a bullish engulfing, in the 3-5min time frame we can see a clear demand area that gave a point of liquidity 25% mitigation of 15min OB on red dash line-entry on 61%
Target London High

2008 - 2025 History repeats itselfHistory is nothing but repetition.
Mankind writing their own history.

NAS100 at Risk of Breaking Lower Amid Mixed Signals and End-of-MThe NAS100 is showing signs of weakness, with a clear daily pinbar candle signaling potential downside reversal. After a strong rally, the index appears overextended and vulnerable to a technical retracement. End-of-month profit-taking is likely adding pressure, as traders lock in gains and rebalance portfolios.
Uncertainty around reciprocal tariffs is also weighing on sentiment. Comments from U.S. officials, including Bessent, emphasize the need for renewed dialogue with China—highlighting unresolved tensions that could escalate. These trade concerns are surfacing just as the market is priced for optimism, increasing the risk of a pullback.
From a technical perspective, the daily pinbar near recent highs indicates a rejection of upward momentum. If confirmed with a break below the recent low, a move toward 20,400 or even the 50-day moving average could follow.
Seasonal flows and shifting sentiment may further limit upside in the short term. Any risk-off tone from global headlines or softer macro data could accelerate the move lower. Until the index clears resistance with conviction, the bias may now tilt to the downside. Traders should watch for follow-through signals and consider tightening stops.

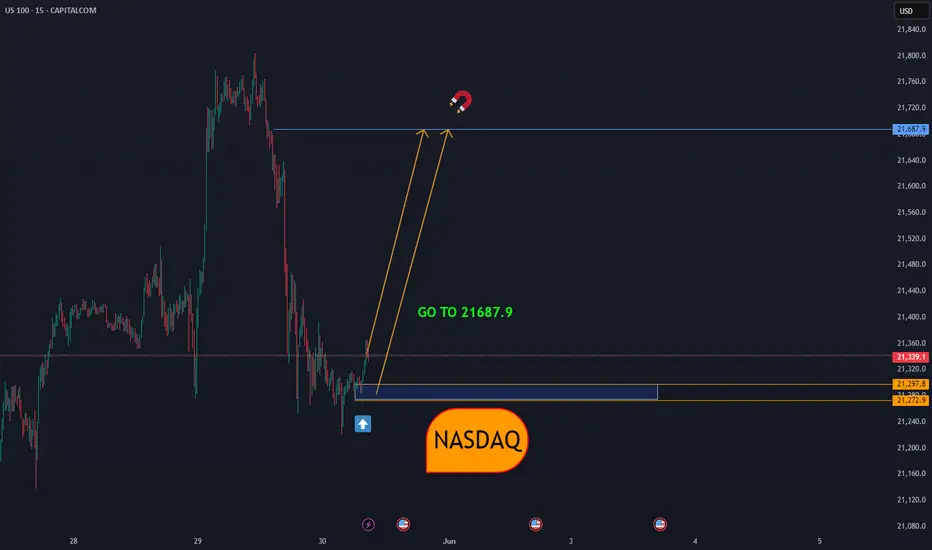
NASDAQGiven the geometry that has been created, there is a possibility of a correction towards the price of 21687.9, either from the current price or from a little lower, if the bottom of 21219 is broken, another decision must be made.
NASDAQ:NDX
Nas100 Analysis Doesn't get any easier than this!
Seen price reversing from a strong AOI (38%) took buys targeting the -27 also the -61 on the fibonacci