NAS100 - Potential TargetsDear Friends in Trading,
How I see it,
Severely bullish extension - Potential correction
Prevailing Rally - "LONG" Targets:
1] 22636.00
2] 23220.00
Potential Correction - "SHORT" Targets:
1] 22173.00
2] 22000.00
"ONLY IN CASE CORRECTION ZONE IS BREACHED!"
3] 21450.00
Keynote:
I would refer from looking for shorting setups in such a strong bullish environment.
Wait for the market to come to you.
I sincerely hope my point of view offers a valued insight.
Thank you for taking the time to study my analysis.
USTEC trade ideas

NAS100 Breakout – Eyeing Bullish Extensions or False Break?The NAS100 (US100) is in full breakout mode on the daily, surging past previous highs near 22,140 with strong momentum. Price is now trading at ~22,550, decisively above prior resistance, which could now act as support if we retest.
🔎 Multi-Timeframe Breakdown:
✅ Daily Chart:
• Massive bullish structure intact.
• Clean breakout above horizontal resistance at 22,140.
• Price riding an aggressive ascending trendline — watching for sustained closes above breakout level.
✅ 4H Chart:
• Higher lows and bullish impulsive candles confirm buyers in control.
• Multiple support zones below (22,300, 22,100) for potential retests.
• Key short-term resistance formed near 22,650 — a rejection here could trigger correction.
✅ 1H & 23m Charts:
• Micro pullback seen after tagging fresh highs; price still holding above short-term trendlines.
• Consolidation zone between 22,500–22,600 could be decisive for next move.
⸻
📌 Key Zones to Watch:
• Support: 22,300 / 22,140
• Resistance: 22,650 / 22,800
• A breakout retest could confirm continuation; otherwise, failure to hold support might signal a fakeout.
⸻
📈 Bias: Bullish (Long)
While momentum remains strong, be prepared for potential sharp corrections given overextension.
⸻
What do you think? Drop your thoughts below! 🚀👇

US100 – Extended Rally, Eyes on Pullback to Key SupportUS100 continues to show impressive strength, with no real signs of slowing down yet. The recent push above the previous all-time high came with strong bullish candles and high volume, confirming the breakout as legitimate rather than a false pump. This surge followed a clean retest of the fair value gap below, which acted as a springboard for the next leg higher.
Imbalance Retest and ATH Break
Before the breakout, price perfectly respected the FVG just above the 20,800 zone. That retest was crucial, showing institutional interest in defending higher prices. From there, the index cleared the old ATH with authority, and we are now trading comfortably above it, establishing new highs in the process.
Support Zone Outlook
While momentum remains bullish, the market doesn’t move in a straight line forever. A short-term cool-off is possible. I’m eyeing the marked-out support zone just above 21,400, which previously acted as resistance and now flips to demand. If we do pull back, this is the most logical area for buyers to step back in.
Potential Price Path
The dotted projection outlines two possible paths: one, a minor pullback followed by immediate continuation, and two, a deeper retest into the green support zone before resuming the uptrend. Both scenarios remain bullish as long as price stays above that support. A retest into this level would be healthy and provide a clean long entry for continuation.
Key Levels to Watch
The area around 21,400 to 21,700 is critical. If we revisit this zone, I’ll be watching for bullish price action to confirm continuation. On the upside, we’re now in price discovery mode, so upside targets are more open-ended, but 23,000+ becomes a magnet if momentum stays intact.
Conclusion
US100 is in strong bullish territory, with institutional signs backing the move. A pullback would be welcome and likely provide a high-probability long setup. Until the structure breaks, I remain bullish on this index, watching for a healthy dip into the support zone for potential continuation higher.
Disclosure: I am part of Trade Nation's Influencer program and receive a monthly fee for using their TradingView charts in my analysis.
___________________________________
Thanks for your support!
If you found this idea helpful or learned something new, drop a like 👍 and leave a comment, I’d love to hear your thoughts! 🚀

NASDAQ Potential UpsidesHey Traders, in today's trading session we are monitoring NAS100 for a buying opportunity around 22,380 zone, NASDAQ is trading in an uptrend and currently is in a correction phase in which it is approaching the trend at 22,380 support and resistance area.
Trade safe, Joe.

US100 BEARISH BIAS RIGHT NOW| SHORT
US100 SIGNAL
Trade Direction: short
Entry Level: 22,518.7
Target Level: 21,870.2
Stop Loss: 22,949.8
RISK PROFILE
Risk level: medium
Suggested risk: 1%
Timeframe: 9h
Disclosure: I am part of Trade Nation's Influencer program and receive a monthly fee for using their TradingView charts in my analysis.
✅LIKE AND COMMENT MY IDEAS✅

Upward momentum of Nasdaq has broken major resistanceUpward momentum of Nasdaq has broken major resistance.

Fractal, 3 steps down then upFractal is based on the whole move of 2024 -2025 flipped and mirrored, seems to be quite accurate. Buying back in when under the recent base. This drop will be quick and hard.
Not trading advice

WRONG!, THIS IS A BAD IDEA, SHORT INDEXESYa know... as the title says. It's wrong, nothing about this idea is sensical... but that's where it just might pay off. Non-sense. One special person to take the bull by the horns and say "I want in at better prices"...
This is not trading advice nor a valid idea, nothin says the chart will reverse... being early and being right eventually doesn't usually pay... but watch for signs... they may come.

NAS SETUPNas 100 setup using smart money concepts. A change in the state of price delivery has occured at level 22,518.48 then we wait for entry cnfirmation when price either touch the bearish order lock at level 22,519.23 or when it comes back to the fair value gap to rebalance price at level 22,560.67 ....hence we are shorting the market when our rules are met

NAS100 – Short from Premium Post-ATH Liquidity Sweep (27-06-25)
Buyside liquidity swept at 22,554.05 after fresh ATHs. Short triggered on a strong bearish news candle from premium territory. TP set at 22,423.99 near a Bright Gold HeatMap cluster. SL at 22,585.01 above structural highs. Trade thesis driven by Box Theory, liquidity targeting, and expected short-term correction from overextended highs.

Nasdaq Hits New ATH at $22,570 – Eyes Now on $23,200 and $24,000By analyzing the #Nasdaq chart on the weekly timeframe, we can see that the index followed our previous analysis perfectly, hitting the $22,400 target and printing a new all-time high at $22,570!
Momentum remains strong and bullish, and we expect price to continue climbing toward the next targets. Based on the original projection, upcoming targets are $23,200 and $24,000.
Stay tuned for the next update!
Please support me with your likes and comments to motivate me to share more analysis with you and share your opinion about the possible trend of this chart with me !
Best Regards , Arman Shaban

Trade alert triggered! Tiqgpt setupAnalyzing the US Tech 100 CFD across multiple timeframes, we observe a consistent bullish momentum from the daily down to the 1-minute chart. The daily and 4-hour charts show a series of strong bullish candles, indicating a robust institutional buying presence. The 1-hour chart confirms this trend with a continuation of bullish candles, although there's a slight pullback visible, suggesting a temporary liquidity grab before further upward movement. The 15-minute charts show a more detailed view of this pullback, which appears to be a healthy correction within a broader bullish trend. The 1-minute chart shows increased volatility and some consolidation, typical of lower timeframes where retail traders are more active.
INSTITUTIONAL THESIS: Institutions are likely in a phase of accumulation and distribution, using pullbacks to gather more positions before pushing the price higher. The consistent higher highs and higher lows across timeframes suggest a strong bullish bias. The recent pullbacks on lower timeframes are likely temporary, serving to trap bearish retail traders before continuation of the uptrend.
LEARNING POINT: The pullback seen on the 1-hour and 15-minute charts can be interpreted as a liquidity grab, where institutions are likely stopping out weak bearish positions before continuing the bullish trend. This is a classic example of "stop hunt" before trend continuation.
SIGNAL: BUY SYMBOL: US Tech 100 CFD ENTRY PRICE: $22,500.0 STOP LOSS: $22,480.0 (Below the recent minor pullback on the 15-minute chart) TARGET PRICE: $22,600.0 (Just below the recent highs to ensure liquidity for exit) CONDITION: Buy limit order at $22,500.0 following a confirmed bullish reaction off the $22,500.0 level on the 15-minute chart RATIONALE:
Market Structure: Consistent higher highs and lows across all timeframes.
Order Flow: Institutional buying evident from large bullish candles.
Liquidity Behavior: Recent pullbacks likely represent liquidity grabs.
Pressure Analysis: Strong bullish candles indicate institutional pressure.
Strategies Used: Liquidity grab and continuation, intraday accumulation. URGENCY: MEDIUM TIMEFRAME: Short-term CONFIDENCE SCORE: 85% (Based on the clear bullish structure and institutional buying signs) **RISK/REWARD RATIO: Risk=$20.00, Reward=$100.00, Ratio=1:5.0
Risk = $22,500.0 - $22,480.0 = $20.0
Reward = $22,600.0 - $22,500.0 = $100.0
Ratio = $100.0 / $20.0 = 5.0

US Tech 100 CFD broke the Resistance level 22,365.0 range👀Possible scenario:
U.S. stock futures climbed on June 27, with the S\&P 500 and Nasdaq nearing record highs as investors awaited May’s PCE inflation report — the Fed’s preferred gauge — due at 8:30 a.m. ET.
Rate cut expectations grew following reports that President Trump may replace Fed Chair Powell by fall. The odds of a July rate cut rose to 20.7%, up from 14.5% last week. Soft GDP growth, rising jobless claims, and a rare earth trade agreement with China added to the dovish outlook. Also due June 27 final June consumer sentiment data and remarks from several Fed officials.
✅Support and Resistance Levels
Support level is now located at 21,360.0
Now, the resistance level is located at 22,570.0

USNAS100 Hits New ATH | Watch 22,520 for Possible Correction USNAS100 TECHNICAL OVERVIEW
Nasdaq 100 Prints New ATH | Eyeing 22,640, But Correction Risk Builds
USNAS100 recorded a new all-time high, supported by broad bullish sentiment across U.S. indices after upbeat S&P and inflation data boosted risk appetite.
Technically, the index remains bullish, but signs of short-term exhaustion are appearing.
If the price closes below 22,520 on the 1H timeframe, a correction toward the 22,280 zone is likely.
However, a clean break above 22,640 would confirm continuation toward the next upside target at 22,790.
Key Levels
Pivot Line: 22,520
Resistance: 22,640 → 22,790
Support: 22,410 → 22,280 → 22,200
Take a look at the previous idea to see more reality...

Nasdaq Analysis before market .If you do a top down analysis you will see /nq potentially working in the bulls favor. Especially if you own tech stocks. Its been steadily rising. with a couple hick-ups but look at the arrows on the 1 hour timeframe. The VWAP was showing a peak and than dropping. The chart soon to follow. Reversing. Yesterdays top and bottom were in line with an continuation and big $$$ taking profit,s than continued up the mountain.
Have a good day.

Smart Friday Trades: NASDAQ Setup and Key Levels to Watch NAS100📊 NASDAQ US100 Analysis – Friday Setup
I'm currently watching the NASDAQ closely 👀. The NAS100 looks significantly overextended 📈, and with it being the end of the week, we often see price action push into the weekly high before pulling back into the weekly close 🔁.
This is a pattern I’ve seen play out many times during the New York session on Fridays 🗽📉.
💡 Here’s my suggestion:
Wait for today’s data release 📅 to finish. If price ranges and then breaks market structure to the downside, keep an eye out for a short entry on the retrace and retest of the range low.
🎯 Your targets and stop loss are outlined clearly in the video, so make sure to watch it through.
⚠️ Trade sensibly, manage your risk, and don't rush into anything.
I'd love to hear your thoughts in the comments 💬
Have an awesome day and I’ll see you in the next one! 🚀

Nasdaq100OANDA:NAS100USD
3. And Then price will begin to push down strong. This will happen only if there will be a very strong spike meaning an incredible amount of sells pushing the price down.

Tomorrow marks start of downtrend?NASDAQ just swept all-time highs into a key diagonal trendline drawn from previous major swing highs. We’re now in the premium zone of a macro fib retracement, and Asian session is showing signs of accumulation around 22,460.
Expecting London session to run Asian highs, tapping 22,500, which lines up perfectly with:
✅ Major rising trendline resistance
✅ 0.0 fib (ATH)
✅ Asian liquidity sweep
✅ High probability "Manipulation" phase of AMD (Accumulation–Manipulation–Distribution)
Looking to short at 22,500 with a tight SL at 22,520–22,530, targeting a full swing retrace into 20,500.
Confluences:
Bearish AMD setup across sessions
Major trendline rejection zone
Premium fib zone (swing retracement logic)
Liquidity sitting below multiple structural lows
Risk-to-reward of 1:100 potential if held to target
Waiting for confirmation via lower timeframe BOS after the sweep. If 22,500 holds as resistance post-sweep, this could be the beginning of a broader correction.
Let’s see how it plays out. 🔥

Nasdaq-100 Wave Analysis – 26 June 2025- Nasdaq-100 broke major resistance level 22100.00
- Likely to rise to resistance level 23000.00
Nasdaq-100 index recently broke above the major resistance level 22100.00 (which has been steadily reversing the index from the end of 2024 as can be seen from the weekly NDX chart below).
The breakout of the resistance level 22100.00 continues the active primary impulse wave 3 from the middle of 2025.
With the accelerating weekly momentum, Nasdaq-100 index can be expected to rise to the next resistance level 23000.00.

US100 (NASDAQ 100 Index) – Breakout with Clear Upside ProjectionUS100 has broken out cleanly above the key resistance at 22,097.1, indicating bullish continuation. The breakout is supported by strong upward momentum, targeting the next key level around 23,441.9, as illustrated by the projected range.
Support at: 22,097.1 🔽 | 20,750.0 🔽
Resistance at: 23,441.9 🔼
🔎 Bias:
🔼 Bullish: Sustained price action above 22,097.1 keeps the bullish breakout valid, aiming toward 23,441.9.
🔽 Bearish: A drop back below 22,097.1 would invalidate the breakout, possibly pulling price toward 20,750.0.
📛 Disclaimer: This is not financial advice. Trade at your own risk.

US100 BULLISH BREAKOUT|LONG|
✅US100 is going up
Now and the index made a bullish
Breakout of the key horizontal
Level of 22,222 and the breakout
Is confirmed so we are bullish
Biased and we will be expecting
A further bullish move up
LONG🚀
✅Like and subscribe to never miss a new idea!✅
Disclosure: I am part of Trade Nation's Influencer program and receive a monthly fee for using their TradingView charts in my analysis.

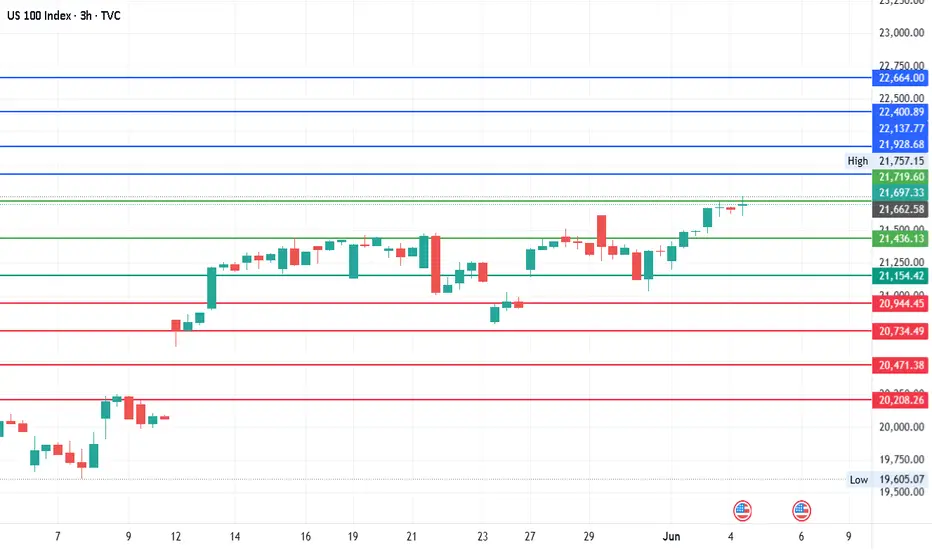
#NDQ - Pivot Point: 21,436.13Date: 30-05-2025
#NDQ Pivot Point: 21436.13 Support: 21154.42 Resistance: 21719.60
Upside Targets
Target 1: 21928.68
Target 2: 22137.77
Target 3: 22400.89
Target 4: 22664.00
Downside Targets:
Target 1: 20944.45
Target 2: 20734.49
Target 3: 20471.375
Target 4: 20208.26
US100 - Liquidity sweep above the ATHIntroduction
The US100 has been exhibiting a strong upward trend on the daily timeframe ever since the sharp correction in early April. This sustained bullish momentum culminated in a break above the previous all-time high (ATH) earlier today. However, this breakout may not be entirely convincing just yet, as there are signs of a potential short-term reversal. The move above the ATH could represent a liquidity sweep, where price action briefly pushes past a key level before retracing, possibly trapping late buyers.
Liquidity Sweep
On the daily chart, the US100 did succeed in breaching the previous ATH, but the breakout appears to have been short-lived. Price quickly reversed after the new high was printed, leaving behind only a wick above the ATH. This type of price action forms what is commonly referred to as a swing failure pattern, a scenario where the market tests liquidity above a key level before turning back down. Such a pattern often signals upcoming weakness, especially when the breakout lacks strong follow-through or volume support.
4H Fair Value Gap (FVG)
During the most recent leg up, the US100 left behind an unfilled fair value gap (FVG) on the 4-hour timeframe. This imbalance zone, created when price moves too quickly in one direction without enough time for buyers and sellers to match orders evenly, often acts as a magnet for price to return to. In the context of the current market structure, this 4H FVG could provide a meaningful support level if the index does experience a pullback. Should the index find support here and show signs of renewed buying interest, the broader uptrend is likely to continue. However, if this zone fails to hold, we may see a deeper retracement toward lower support levels.
Conclusion
While the US100 remains in a strong and well-defined uptrend on the higher timeframes, the recent price action above the ATH introduces the possibility of a short-term pullback. The appearance of a swing failure pattern and the presence of an untested 4H FVG suggest that some corrective movement could unfold in the near term. That said, the FVG presents a key area to watch for bullish continuation. If buyers step in at this imbalance zone, the index could resume its upward trajectory, reaffirming the strength of the current trend.
Disclosure: I am part of Trade Nation's Influencer program and receive a monthly fee for using their TradingView charts in my analysis.
Thanks for your support.
- Make sure to follow me so you don't miss out on the next analysis!
- Drop a like and leave a comment!
