be ready for jump with TRB
YOUR LIKE OR COMMENT IS MY FUEL FOR NEXT ANALYSIS :) IF U HAVE ANY QUESTION REACH ME HERE
This is not a financial advice. Always do your own research and always put stoploss in your trade (SL) :) If you want more detailed info how to study and read charts or just need help with some coin, just write to me here a comment, i will try to answer to everybody... i can help you :) all for free, don't worry, BE HAPPY!
********************************************CHECK MY LATEST ANALYSIS DOWN BELOW********************************************
TRBBTC trade ideas

Tellor (TRB) formed BAT pattern | A good long opportunityHi dear friends, hope you are well and welcome to the new update on Tellor ( TRB ) token with BTC pair.
On a small time period 2-hour chart, the price action of the TRB token has completed the final leg of bullish BAT and entered the potential reversal zone.
Possible profit and loss ratio:
This trade has a profit possibility of 14.5 % and the loss possibility is 2.5%.
Note: Above idea is for educational purpose only. It is advised to diversify and strictly follow the stop loss, and don't get stuck with trade.

TRB both pairs are greatYOUR LIKE OR COMMENT IS MY FUEL FOR NEXT ANALYSIS :) IF U HAVE ANY QUESTION REACH ME HERE
This is not a financial advice. Always do your own research and always put stoploss in your trade (SL) :) If you want more detailed info how to study and read charts or just need help with some coin, just write to me here a comment, i will try to answer to everybody... i can help you :) all for free, don't worry, BE HAPPY!
********************************************CHECK MY LATEST ANALYSIS DOWN BELOW********************************************

TRB/BTC a perfect opportunityThis is the altcoin season and TRB is one of the best-looking coins out there because it is lagging behind others toooo much. You might enjoy this one...

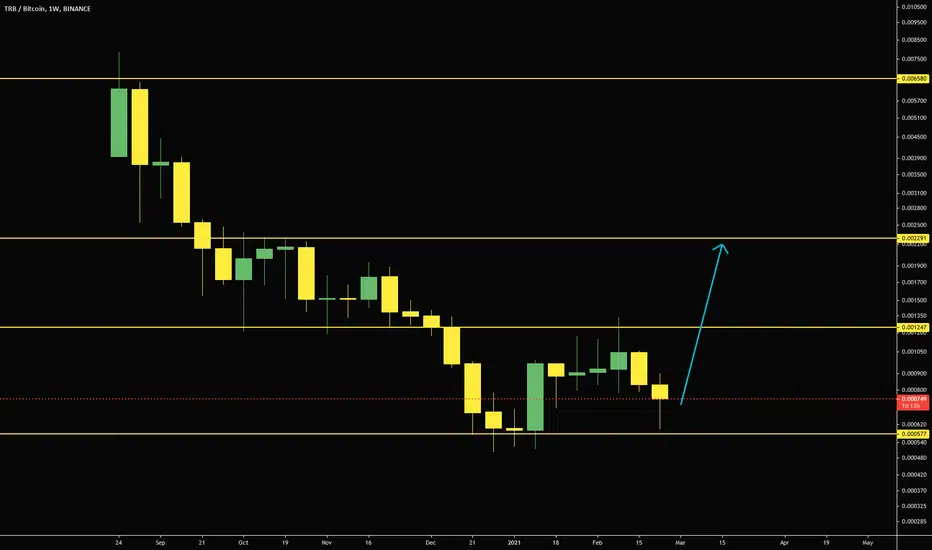
TRB/BTC Nice channel with grow possibilities. My targets are in yellow, i'm entering now and in the lower box.
"Not financial advice, just my hobby" Please leave a like and a comment, I like positive critism!

TRB/BTC SIMPLE MID TERM TARGET TRB/BTC yet not pumped properly which has a long way to go. I believe it will pump hard when breakout from here.

Support flip on the making for $TRB vs BTCIf reclaims old resistance as support Tellor could fly against Bitcoin pair which means on USDT pair will go even harder

TRB /BTC COMPLETE BRAKEOUT ,67% to come within 48 h .hello guys . this is a btc chart in comparisson.please also check the trb/usdt pair on my profil to make sure you make me money with the usdt pair !
hey chads !
i would like to focus my charts,im publishing ,on immininet brakeouts WICH ARE RESULTING IN NO LONGER THAN 3 DAYS . by following me u can be sure u get the real kick !
i use the followig indicators for my analysis.
fibionacci retracement tools
trendlines
TD seq
vol oscilator
rsi storch
vpvr /ichimoku cloud

TRB - It's go time!With the SR flip of the resistance against $BTC, $TRB looks quite strong against both dollar and bitcoin.


$TRB - BUY TIME IS NEAR$TRB needs to break above the immediate resistance. Depending on the market sentiment, it may be soon, or can take upto 10 days.

TRB high return defi coinTellor — a Defi decentralized oracle network
New project and supported by many exchanges.
Sell targets:
0.002 - 0.006 - 0.015


TRB could skyrocket in the next daysThe price is retesting a major resistance line. I expect it to go up once it's broken.


Tellor (TRB) Inverse Head & Shoulder (IH&S)TRB is forming the inverse Head & Shoulder (IH&S) pattern. We will see a good rally in TRB after it breaks the neckline. The main resistant zone is 900 and after that TRB will skyrocket.
Buy Zone: 660-670
Target: 740-810-900-1050-1270-1500-1800
Stop Loss: 574

TRB/BTC 1D Chart.Trb has been in a long downtrend with respect to Bitcoin and a huge bullish divergence can be spotted now. I am looking for a reversal soon and with altseason round the corner this could be a good oracle pick!

Ready To Jump Upwards ❕ The Price Sitting At All-Time-Low Support And Ready To Jump Upwards
✅ Targets At The Chart
🔴 Stop loss zone : 1160 ~ 1150

TRBBTC 12H long setup; Targeting top of the accumulation zoneTA Explained
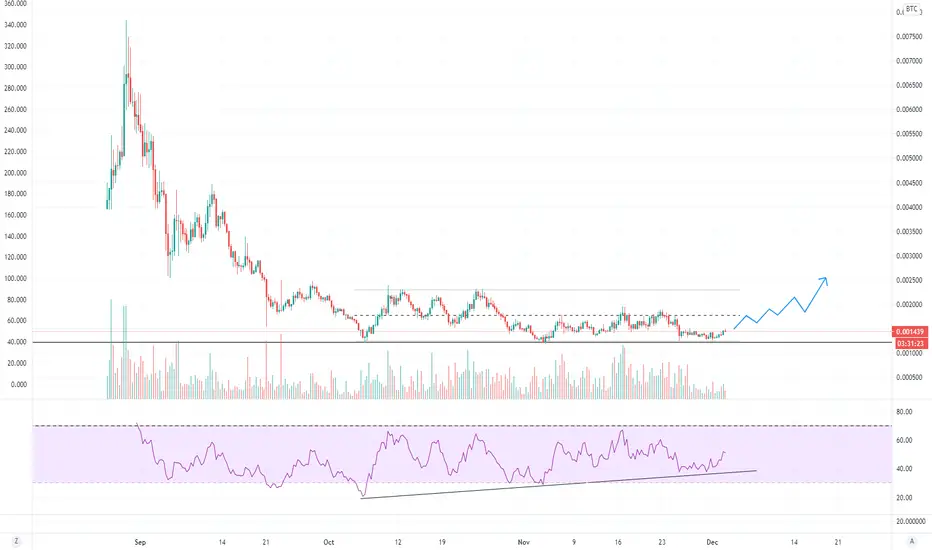
TRB ranges in this horizontal zone for some time now. After the bounce on the support zone and the break of the descending trendline a upward move can be expected. After the break of the TL a pullback into the entry zone would be the best way to enter a position.
SL can be pretty tight because the setup will be invalidated if support is lost.
Trade setup
Best entries: 0.001254 -0.001322
TP1: 0.001642
TP2: 0.001893
TP3: 0.002299
SL: 0.001141
RR: 6.82
Max leverage: na
—————
Do Your Own Research (of course)
Trade at own risk (of course)
Only trade what you can afford to lose (of course)

TRB in the BUY ZONE - time to HODLTRB doesn't like primed for a pump just yet, but it's a great time to start accumulating. I'm not sure if this one is ready to take off in December with the rest of the altcoins, but I will keep an eye on it as it gains momentum.
**DYOR - NOT FINANCIAL ADVICE**

Tellor 8h Mid to Long term tradeTellor looks to have entered into a range.
Since its near bottom of range it is a good risk adjusted spot.
This is not trading advice nor is it how I will play this.
I just like to draw lines and color.
enjoy.