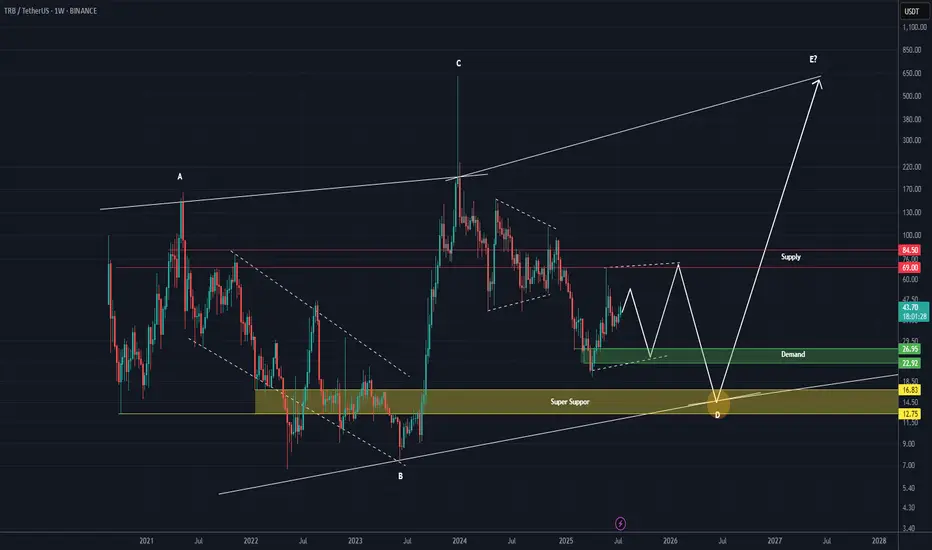
TRB Roadmap (1W)It appears to be within wave D of a larger pattern.
Given the strong rally in wave C, it is expected that this coin will enter a time-consuming correction, so considering a symmetrical pattern for wave D is not illogical.
A short-term upward swing is expected from the green zone.
However, the mai
Related pairs
TRB : FREE SIGNALHello friends🙌
📈Given the price reaching its bottom and the buyers supporting it, you can see that a classic head and shoulders pattern has formed and buyers have entered. For this reason, you can buy with capital and risk management and move with it to the specified targets.
🔥Follow us for more s

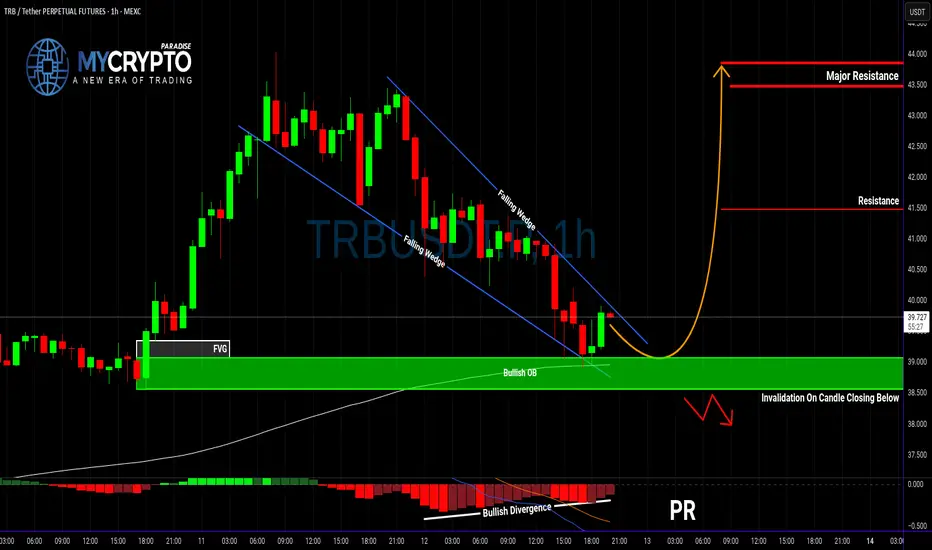
TRBUSDT: Massive Bullish Setup or a Fakeout Trap?Yello Paradisers — is TRBUSDT gearing up for a major breakout, or is this just another fakeout before a deeper drop? Our previous calls have been consistently accurate, and now this chart is flashing multiple signals that deserve your full attention.
💎Currently, TRBUSDT has formed a textbook fallin
TRBUSDT - at CUT n REVERSE Area? What's next??#TRBUSDT - market just reached at his ultimate supporting region and below that we can expect a further straight drop.
So we will cut n reverse below our mentioned region that is around 35 (region neck line)
Good luck
trade wisely

Today's signalHello friends🙌
🔊After the good growth of this currency, you can see that the price has corrected at the top of the channel and now that we are near the bottom of the channel, there is a good opportunity to buy in stages and with capital and risk management and move with it to the specified goals.

TRBUSDT Setup – Staggered Exits, Smart Profits📌 Entry: 36.70
🎯 TP1: +10% → Secure 50% of position
🛡️ Move to risk-free after TP1 to protect capital
🎯 TP2: Take 50% of remaining volume
🎯 TP3: Close all remaining volume
Calculated exits. Risk-managed. Momentum-ready.

TRBUSDT Setup – Staggered Exits, Smart Profits📌 Entry: 36.70
🎯 TP1: +10% → Secure 50% of position
🛡️ Move to risk-free after TP1 to protect capital
🎯 TP2: Take 50% of remaining volume
🎯 TP3: Close all remaining volume
Calculated exits. Risk-managed. Momentum-ready.

TRBUSDT Long with good RRTRBUSDT with bullish pivots, follows with divergence on smaller time frames, possible reversal with FakeBO, a good Risk Reward. First 85 daily target on fibonacci levels.

TRBUSDT on the Verge of a Major Move – Breakout or Breakdown?Yello, Paradisers! Is TRBUSDT gearing up for a bullish breakout, or is a deeper retracement coming? Let’s break it down.
💎TRBUSDT is forming an ending diagonal while showing bullish divergence, increasing the probability of an upward move. But for this bullish scenario to play out, we need confirma

TRBUSDT / LONG / 10.06.25⬆️ Buy TRBUSDT, 10.06.25
💰 Entry: 47.52
🎯 Target: 140.12
⛔️ Stop: 39.12
Reasons for entry:
— 1D
Price in consolidation for more than 1 day
Correction to the discount zone
— 1H
Divergence in long, exit from correction
Decrease in volumes during correction
Predominance of volumes for purchase
— 1

See all ideas
Summarizing what the indicators are suggesting.
Oscillators
Neutral
SellBuy
Strong sellStrong buy
Strong sellSellNeutralBuyStrong buy
Oscillators
Neutral
SellBuy
Strong sellStrong buy
Strong sellSellNeutralBuyStrong buy
Summary
Neutral
SellBuy
Strong sellStrong buy
Strong sellSellNeutralBuyStrong buy
Summary
Neutral
SellBuy
Strong sellStrong buy
Strong sellSellNeutralBuyStrong buy
Summary
Neutral
SellBuy
Strong sellStrong buy
Strong sellSellNeutralBuyStrong buy
Moving Averages
Neutral
SellBuy
Strong sellStrong buy
Strong sellSellNeutralBuyStrong buy
Moving Averages
Neutral
SellBuy
Strong sellStrong buy
Strong sellSellNeutralBuyStrong buy
Displays a symbol's price movements over previous years to identify recurring trends.
Frequently Asked Questions
The current price of Tellor / Tether (TRB) is 41.81 USDT — it has risen 3.29% in the past 24 hours. Try placing this info into the context by checking out what coins are also gaining and losing at the moment and seeing TRB price chart.
Tellor / Tether price has fallen by −2.47% over the last week, its month performance shows a 12.51% increase, and as for the last year, Tellor / Tether has decreased by −40.26%. See more dynamics on TRB price chart.
Keep track of coins' changes with our Crypto Coins Heatmap.
Keep track of coins' changes with our Crypto Coins Heatmap.
Tellor / Tether (TRB) reached its highest price on Dec 31, 2023 — it amounted to 600.00 USDT. Find more insights on the TRB price chart.
See the list of crypto gainers and choose what best fits your strategy.
See the list of crypto gainers and choose what best fits your strategy.
Tellor / Tether (TRB) reached the lowest price of 5.00 USDT on Oct 31, 2021. View more Tellor / Tether dynamics on the price chart.
See the list of crypto losers to find unexpected opportunities.
See the list of crypto losers to find unexpected opportunities.
The safest choice when buying TRB is to go to a well-known crypto exchange. Some of the popular names are Binance, Coinbase, Kraken. But you'll have to find a reliable broker and create an account first. You can trade TRB right from TradingView charts — just choose a broker and connect to your account.
Crypto markets are famous for their volatility, so one should study all the available stats before adding crypto assets to their portfolio. Very often it's technical analysis that comes in handy. We prepared technical ratings for Tellor / Tether (TRB): today its technical analysis shows the buy signal, and according to the 1 week rating TRB shows the neutral signal. And you'd better dig deeper and study 1 month rating too — it's sell. Find inspiration in Tellor / Tether trading ideas and keep track of what's moving crypto markets with our crypto news feed.
Tellor / Tether (TRB) is just as reliable as any other crypto asset — this corner of the world market is highly volatile. Today, for instance, Tellor / Tether is estimated as 3.18% volatile. The only thing it means is that you must prepare and examine all available information before making a decision. And if you're not sure about Tellor / Tether, you can find more inspiration in our curated watchlists.
You can discuss Tellor / Tether (TRB) with other users in our public chats, Minds or in the comments to Ideas.