Unveiling Hidden Bullish Divergence: Targeting $156 Fibonacci 📈 Spotting Hidden Bullish Divergence! 🚀
Hey traders! 📣 Keeping an eye on some exciting market dynamics here. Just identified a hidden bullish divergence pattern over the last 2 to 3 days on our charts. 📊 This pattern often signals a potential reversal in the current downtrend and hints at an upcoming bullish momentum.
🔍 Hidden bullish divergence occurs when the price forms lower lows, while the corresponding oscillator (such as the RSI or MACD) forms higher lows. It suggests that even though the price is trending downwards, the momentum behind the selling pressure is weakening, and a bullish reversal might be on the horizon. 📈💡
Now, onto the juicy part – our Fibonacci retracement levels! 🎯 The next fib target we're eyeing is at the $156 mark. Historically significant, this level could serve as a crucial pivot point for the current price action. 🎯💰
Breaking above $156 could trigger a significant bullish move, potentially propelling the price back towards the $365 to $560 range. 🚀📈 So, keep a close watch on this level as it could mark the beginning of a substantial upward trend.
Remember, trading involves risk, so make sure to employ proper risk management strategies. Stay tuned for further updates as we track this exciting development! 💼💰
Disclaimer: This analysis is for informational purposes only and should not be considered financial advice. Always do your own research before making any investment decisions. 📚💡 #TradingView #TechnicalAnalysis #BullishDivergence #FibonacciLevels #MarketAnalysis 📊📈
TRBUSDT trade ideas

TRBUSDT Next Target 500$.TRBUSDT Technical analysis
TRBUSDT Currently trading at $115
TRB/USDT is on the verge of another breakout and clearly heading towards our next Target around 500$.
As the whole crypto market is currently on the bullish sentiments and expected a new ATH before the halving. So we are confident in the breakout and another clean rally towards 500$.
Fundamentally TRB is one interesting and technology sound project which has the potential to be in the top 50 projects.
Buy level: Above $114
Stop loss: Below $75
TP1: $144
TP2: $220
TP3: $315
TP4: $500
Max Leverage 2x
Always keep Stop loss

TRB/USDT Getting Ready for another Big Leap? 👀🚀TRB Analysis💎Paradisers, let's delve into #TRBXUSDT, as the current market behavior suggests a promising chance for a bullish recovery from its crucial support zone.
💎Observing #Tellor's recent market performance, we see a steady 40% decline from its last peak. Nonetheless, its resilience at the support level of $103.7 indicates the potential for an upward trend.
💎Despite obstacles in setting new highs or eclipsing past achievements, which has cultivated a short-term bearish outlook, the $103.7 mark is key for #TRB. This level stands on the brink of triggering a significant bullish momentum upon reevaluation.
💎As proactive traders, we're always ready with a contingency strategy. If #TRB weakens further from this support, we're looking toward a bullish resurgence beginning at the secondary support of $87.7. However, it's crucial to note, breaching this level might herald extended bearish phases.
💎Stay flexible in your trading approach and vigilant with the market movements, Paradisers. Your ParadiseTeam is actively monitoring, prepared to steer you through these market dynamics.

Bearish on $TRB1. We have tapped in to the H4 mean threshold.
2. We have a clear sellside liquidity waiting to be purged.
3. We have another draw as the H4 OB+

TRB Setting up TRB have a bullish divergence on the daily timeframe and can be setting up for a nice run in the next few days to weeks. once it hold the support of 90.00 we can see a wick down to 70 before moving up.
I am bullish on TRB once its above 100

TRB 2ND BREAKOUT : LONG : LET'S START BREAKING DOWN SOME WRONGSI've heard the usual dismissive labels used in reference to what this little pocket rocket did recently, and as always, I disagree. Quite honestly, in all the time I've been analyzing charts, and trust me, this nerd has spent A LOT of time candle shopping, there have been very few instances where outlier price points were so anomalous that they could confidently be considered as having been manipulated. I've cringed at these terms since the beginning, which quickly led to a blanket boycott of chat rooms, the Ideas page here on TV and participation or interest in any "news" including the sensational articles written by supposed professional analysts. When I started this journey, like anyone, I was under the impression that there had been made enough progress in terms of knowledge gained, that the logical approach would be to seek out the most accomplished students of the craft and learn from them.
I found a video course on Forex markets that appeared authoritative (no clue who it was by, but I know it was pretty famous by then) and reached about two thirds of the way trough before realizing "This guy is a joke.". What killed it for me was his comment about the outlier candle-wicks. He simply said to ignore them as they cannot be explained. I don't know about you, but explaining it is kinda the point, isn't it?
I might have saved myself a lot of solitude had I possessed the ability to accept what I'm told by those who have clearly succeeded in the world, but that's never been a pill I could swallow. So, I did the only thing that made sense to me.. I went solo.. If there's nothing to be learnt from the people at the top besides name calling and witch hunts, then I'm clearly better off making my own way. At least it would be free from stigma and ignorance. There was one thing the presenter said that stuck with me, though; "historic price informs future price" or something to that effect.
The next period doesn't register many memories for me. I quickly became lost in a daily routine that was dedicated exclusively to the task. I looked at every single coin I could find, searching into it's historical performance all the way to the point of listing. This, in itself was oftentimes a curious thing, and to be fair, the only point in the life of any coin that I might agree that there very likely is evidence of price manipulation. It would make sense, since the event, at the exact moment of listing, is the only time where the price isn't regulated or expected to conform to the patterns observed on other exchanges. The interesting thing is that most charts start with a peculiarly large spike. Abnormally large on some, and absolutely enormous..
My theory is that exchanges (or the people running that part of the show, which should be senior management), acquire large bags of the coin prior to listing.. Only they really know when it's scheduled, so the moment it becomes available, they create a wall of purchase orders many times the actual price, which is easy, because there has not been a chance for anyone to sell anything, since the coin doesn't exist on that particular exchange, meaning that anyone who buys it thinking he's getting a ticket on "Wen Moon", is immediately stuck with a large back of overpriced coins, panics and adds to the dump.. This happens in silence and the barriers to entry in order to speak to anyone about it (in the limited cases that there's someone to speak to), are insurmountable. There's no community page where traders communicate among one-another so it can be checked, which means there are some fools out there that regularly and anonymously get absolutely smoked, but there's no real evidence of it, and it doesn't show up on any of the other charts, meaning it will likely never be questioned by anyone and the further the chart progresses from that point, the lower the odds of ever getting caught. Who's gonna listen to someone who got cleaned out by a new listing on a crypto exchange? Nobody. He'll be told that he should have known that it's risky and volatility is normal. But think about how many coins exist in the industry, and they get listed in multiple trading pairs and in multiple instruments other than just spot, which exponentially increases the number of instances of this happening, and it happens on all exchanges, all the time..
The reason I don't believe in the simpleton option of perpetuating stigmas, is because by doing so, we admit and immediately project to others that "I don't understand what I'm talking about, have no interest of digging deeper, cannot think independently..", but more importantly, I've concluded that it's not possible for these rallies to be the result of market manipulation, because they conform to the same exact proportional rule-set which governs all cryptos.. The same exact thing is true for the "rogue candles".. They eventually became one of the tree pillars upon which my methodology was developed, and without them I'd never have formed a comprehensive understanding which led to my TA Method.
The popular thinking, assumptions and blatant lies that are baseless, and in time, I'll debunk and disprove all of them.. Not that I expect it will make a difference to most people, but changing opinions is a result of what I do, not the reason I do it..
Entry price: $120.00, but then I wrote all of this, so now it's $148.50.
Target: $ 495.00

TRB & Two ScenariosHello everyone.
There are two expected scenario for TRB.
First scenario is about the price will reach the price between (263-323) $, then make sharp drop.
In the second scenario the price will drop from around 789 $.
Best luck.

TRB Sell Trade "Step into the world of crypto with me! Get your daily dose of technical analysis covering Bitcoin, altcoins, and more. Follow for insights and be part of the discussion!
💡
Disclaimer: Remember, crypto technical analysis is just a tool. It's not foolproof. Make well-informed decisions by considering other factors like market trends and economic conditions. This is not financial advice."

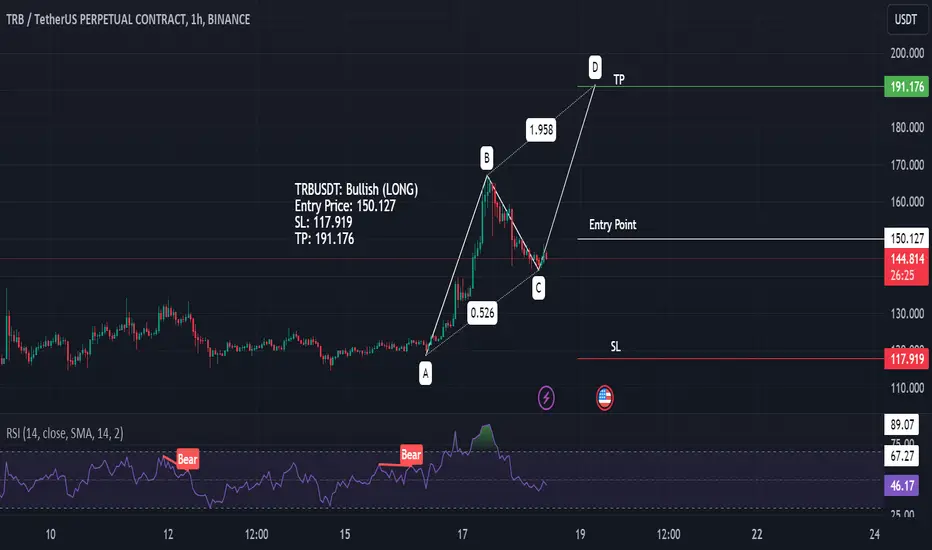
TRBUSDT: Bullish (AB=CD Pattern)TRBUSDT.P is forming AB=CD pattern with no bearish dervergance, and currently move on 0.5 level of fib. so we can take entry on market price. or wait for the break out of the entry point.
TRB Aims 8% then 15% higherTRB trading above the POC. There's a solid resistance level above 8% away. If we can reclaim this level, 15% will be the next target.
Calculate Your Risk/Reward so you don't lose more than 1% of your account per trade.
Every day the charts provide new information. You have to adjust or get REKT.
Love it or hate it, hit that thumbs up and share your thoughts below!
This is not financial advice. This is for educational purposes only.

Trb Is Just waiting to Break Out Seriously Look at how all these moving averages are sqeezing together on the hourly?
I also notice the macd is looking like it could cross any moment
TRB Has a circulating and total supply of only 2.5 milion and has been steadily climbing for the last 2 years
I wouldn't sleep on trb as i could easily see this project being worth over 10k a coin in a bull market scenerio

SHORT #TRBUSDT SHORT #TRBUSDT from $141.959
The instrument moves in a local downtrend, pressing along the slope to the support level, which has several touches with the accumulation of stops of long participants behind them. Similarly, spikes in short volumes and falling highs indicate limit sellers pushing the price to break.
I expect to see smooth trading along the level and an impulse breakdown on the acceleration of the deal feed.

What is TRB's next move?In addition to a bearish CH, we have had a large and sharp falling movement, which indicates that a large descending wave has probably emerged.
We expect movements similar to those drawn on the chart for TRB.
Note that TRB is highly volatile and risky For risk management, please don't forget stop loss and capital management
When we reach the first target, save some profit and then change the stop to entry
Comment if you have any questions
Thank You

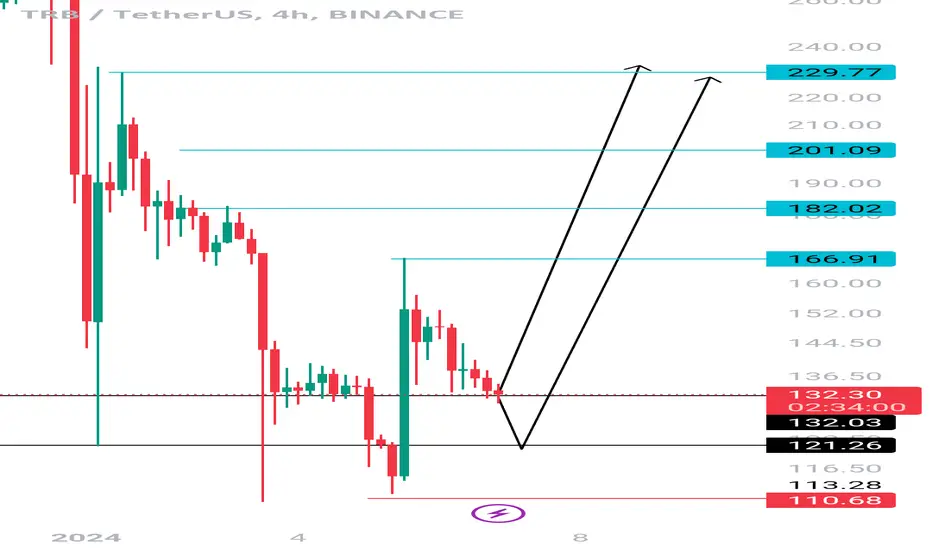
TRB Next Important LevelAfter a decent size pull back, the next level if support is at $137 which is 12% down, and strongest support is at $123. It looks like it wants to go to back to $157 and if it can flip $157 into support, then $192.
Calculate Your Risk/Reward so you don't lose more than 1% of your account per trade.
Every day the charts provide new information. You have to adjust or get REKT.
Love it or hate it, hit that thumbs up and share your thoughts below!
This is not financial advice. This is for educational purposes only.

TRBUSDT.4HBased on the given market data, the TRB/USDT pair seems to be in a bullish trend in the short term as shown by the high 4-hour RSI of 88.25 and the positive MACD of 7.54. The current price of 161.35 is closely approaching the first level of resistance at 169.01, which if broken, could lead the price to the next resistance levels at 189.0 and 195.0. The Bollinger Bands at 169.01 suggest that the market is volatile and could swing in either direction.
In the daily timeframe, the RSI is balanced at 52.82, indicating neither overbought nor oversold conditions. The MACD is negative at -3.42, suggesting a bearish trend. The price has significant room to grow to reach the daily resistance levels at 169.0, 220.0, and 265.0. The Bollinger Bands at 231.0 indicate that the market is less volatile on the daily timeframe.
The 7-day RSI is slightly bullish at 58.72 and the MACD is positive at 32.74. The Bollinger Bands at 189.0 suggest that the market is relatively stable in the 7-day timeframe. The price has significant support at 91.0, 71.0, and 9.0, and faces resistance at 225.0, 305.0, and 372.0.
In conclusion, TRB/USDT appears to be in a bullish trend in the short term but shows mixed signals in the daily and 7-day timeframes. Traders should watch for a break above the resistance levels and also keep an eye on the RSI and MACD for any significant changes. As always, this analysis should be used in conjunction with other indicators and strategies.

2-leg (TRB)📊Analysis by AhmadArz:
🔍Entry: 164.23
🛑Stop Loss: 169.79
🎯Take Profit: 155.87
🔗"Uncover new opportunities in the world of cryptocurrencies with AhmadArz.
💡Join us on TradingView and expand your investment knowledge with our five years of experience in financial markets."
🚀Please boost and💬 comment to share your thoughts with us!

TRB Is Moving Again. Let's Have a Try**Short Fundamental Analysis of Tellor (TRB)**
Tellor (TRB) is a decentralized oracle protocol that provides tamper-proof price feeds for smart contracts on various blockchains. Oracles are essential for connecting off-chain data to on-chain applications, but they have traditionally been centralized and vulnerable to manipulation. Tellor's decentralized approach aims to address these concerns by utilizing a network of oracle nodes that compete to provide the most accurate data.
**Key strengths of Tellor:**
* **Decentralization:** Tellor's oracle network is composed of independent nodes, making it resistant to censorship and manipulation.
* **Transparency:** All oracle submissions are publicly viewable on the blockchain, ensuring transparency and accountability.
* **Efficiency:** Tellor's consensus mechanism is designed to be lightweight and scalable, making it suitable for high-volume applications.
**Recent news:**
* **Tellor Integrates with Binance Smart Chain (BSC):** In October 2023, Tellor announced its integration with BSC, expanding its reach to a broader audience of smart contract developers.
* **Tellor Launches Aggregator Service:** Tellor introduced an aggregator service that combines data from multiple oracles, providing a more robust and reliable source of information for smart contracts.
* **Tellor Ecosystem Grows:** The Tellor ecosystem has been expanding with the addition of new oracles and integrations, demonstrating the growing adoption of its decentralized oracle solution.
**Disclaimer:**
Please note that cryptocurrency investments are inherently risky and volatile. Past performance is not a guarantee of future results. It is important to do your own research and understand the risks involved before investing in any cryptocurrency, including Tellor (TRB).

TRBUSDT. is going to fall or not??#TRBUSDT... so guys lets keep a deep look on TRBUSDT price,
market is near to his resistance area, keep close it and focused on upside resistance area 129 around,
if market hold then we are expecting a drop to bottom 113 around,
don't be lazy here and cash the range.
trade wisely
good luck

TRB/USDT Looks Perfect for Buying! 🚀
💰💎 I am expecting TRB price to rise soon. Targeting a potential growth of 50-80% from current levels. 📈 The chart is showing signs of turning bullish. Let's buckle up and see what happens! 🙌💸
Remember, investing always comes with risks, so make sure to do your own research and make informed decisions. Good luck! 🤞🌟


TRBUSDT Long PositionLong Position
Signal Validity: 10D
Order Price: 76
TP: 168.18
SL: 49.15
CROSS 5X
Risk/Reward Ratio: 3.43
2% Capital

TRBUSDT Bullish Bias (Logarithmic Scale)Here we can see that TRBUSDT has formed a Bullish Pennant. Besides this, it also looks like we're bouncing of the 50EMA (30 Minute TF).
This indicates a nice move going upwards. Use your own setups for entry.
My personal target will be 191.

TRB/USDT Analysis: Anticipating a Potential 15-30% Price RecoverIn this Trading View analysis, we explore the outlook for the TRB/USDT trading pair. Please note that the following content does not constitute financial advice; thorough research and personal diligence are essential.
After careful analysis, it appears that TRB/USDT is presenting an optimistic opportunity for a substantial price rebound. With the potential for a 15-30% increase, our analysis highlights key indicators supporting this prediction.
However, it is important to emphasize that this analysis is for informational purposes only and should not be considered as financial advice. We encourage you to conduct your own research (DYOR) and exercise caution in making trading decisions.
Remember, market conditions are subject to change, so it is vital to monitor the pair closely and stay updated on relevant news and developments. Trade responsibly and at your own risk.