TRB Finished The Retracement. We Try A Buy Trade. Welcome to our crypto exploration hub! We're here to navigate the exciting world of digital assets, providing you with comprehensive insights into market dynamics and potential trading opportunities.Our mission is to decode the crypto market's mysteries and equip you with the knowledge you need to make informed investment choices. From the latest developments in Bitcoin to the hidden potential of various altcoins, we're your trusted source for daily technical analysis.While technical analysis is a valuable tool, it's important to remember that it's just one piece of the puzzle. We encourage you to take a well-rounded approach to your investments, considering factors like macroeconomic trends, news, and community sentiment.Join us for the freshest analyses, and don't hesitate to join the conversation in the comments below. Keep in mind that our content is purely for educational purposes and should not be construed as financial advice. Always integrate it into your broader investment strategy."
TRBUSDT trade ideas

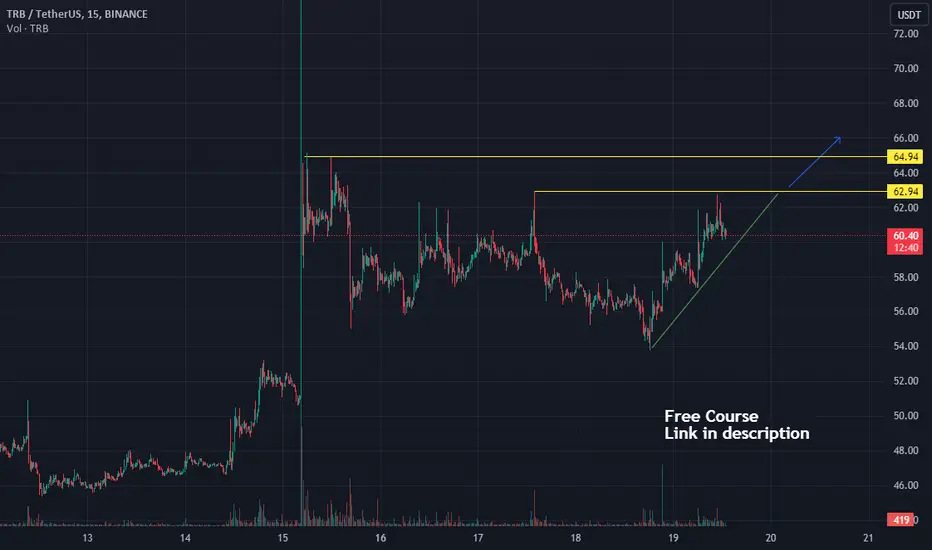
TRB has strong resistance levelThe coin in the "game" formed a level with two approaches, I consider the situation for an impulse breakdown in long after the formation of consolidation near the level, earlier in the history the instrument broke through such formations well, also a participant appears on the spot who pushes the price with densities, entering the breakdown on the activity in the glass and depositing into the level.
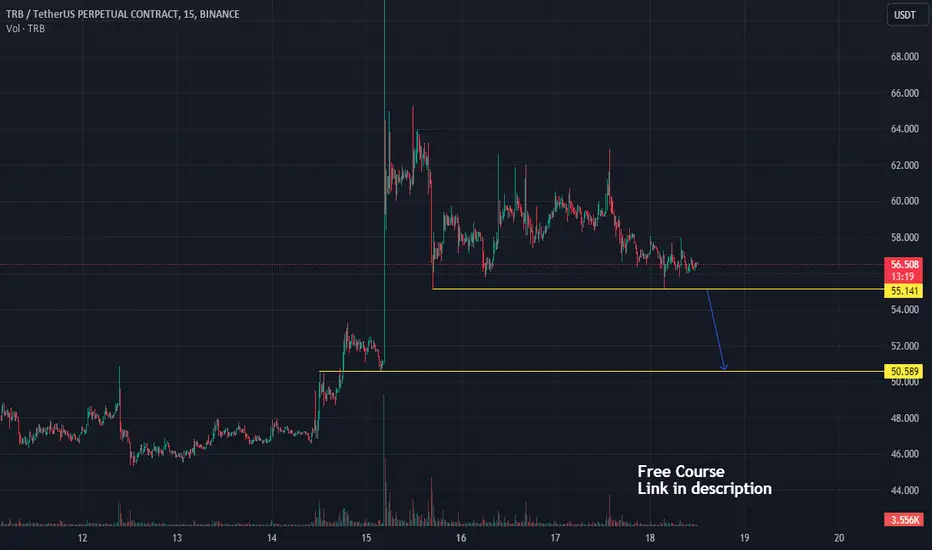
TRB going downThe coin in the game has formed a level with two touches, I am considering the situation for an impulse breakdown in the short after the formation of a trade, entering the breakdown on the activity in the glass and depositing in the level, the goal is to pick up the first pulse
Short opportunity 1 hour chartShort opportunity 1 hour chart
did make a resistance and probably we short. Waiting for a breakout and a retest.

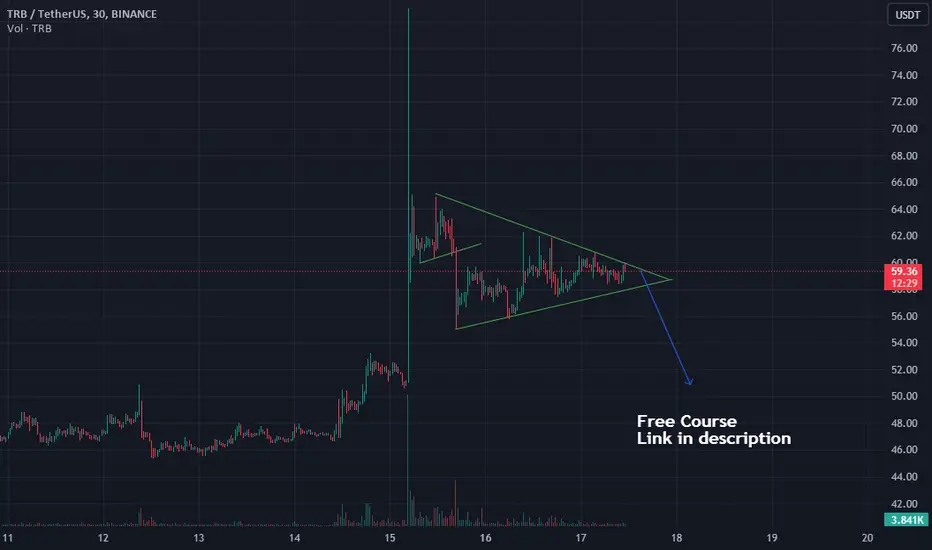
TRB and triangleCoin in the game, increased activity in the glass, there is an increased volume. The instrument has formed a trend of impulse short exits to break through the support line. At the moment, an uptrend has been formed near which the price is consolidating, potentially I expect a short movement to update the local minimum of $ 54
TRB SHORT Signal Free of CostBINANCE:TRBUSDT
i am opening short position at $59 & hold till $45 my Stop loss is $85
maxRECORDS future & Spot trading signal provider is a service that uses technical analysis and market research to provide recommendations and predictions on the future price movements of cryptocurrencies in futures markets. we provide typically analyze market trends, price patterns, and other relevant indicators to identify potential opportunities for profit.

let's think the unthinkableGreetings, fellow traders! In my previous post, I expressed confusion regarding the prolonged price pump of TRBUSDT. However, upon further analysis, I realized that my perspective was limited to the 1-hour and 4-hour charts. By switching to the 1-day or 1-week chart, the price action becomes much clearer.
Current Market Outlook:
Based on the new insights, I believe it is now safe to consider long positions until the next funding fee charge. Here are some factors supporting this view:
1. Breakout of Previous Resistance: All previous resistance levels have been broken
2. Most Recent Resistance at 80: This presents a potential target for the upward move.
3. Funding Fee Impact: The recent funding fee did not trigger a significant downfall, suggesting underlying strength in the current rally.
4. Bear Magnet Backfill: My indicator has detected a bear magnet waiting to backfill(img above red block), indicating the possibility of further upside movement.
5. Previous High Not Revisited
Target and Risk Management:
The safe target for this trade is around 80, with a potential extension to 95 if the bear magnet blocks do not reject further upward movement. However, it is important to note that entering a long position at this stage may involve FOMO (Fear of Missing Out). To minimize risk, it is advisable to employ the "scaling" technique, where smaller amounts are traded to control exposure and move your SL slowly toward profit to prevent sudden dump.
Warning and Conclusion:
It is crucial to highlight that this trade carries significant risk. For those lacking sophisticated risk management strategies and ongoing monitoring capabilities, it may be prudent to refrain from entering at the middle of this apex pump. The unpredictable nature of the market makes careful observation a rewarding strategy in itself. Profit opportunities aside, ensuring prudent risk management and vigilant monitoring should be the priority.
So, fellow traders, stay alert and cautious. Remember, taking necessary precautions and avoiding impulsive actions may benefit you more than simply focusing on the desire for immediate profits. let's ride this wave with care, and , do not take naps!

📊#TRB skyrockets through cup-and-handle structure, chase bulls⚠✔️The target area of the bullish structure of the TRB cup has been achieved, whether it will continue to continue the bulls we do not know, but there is certainly a risk of falling back, and it is not recommended that we chase more now.❌
➡️If we want to go long, we need to wait for a new bull structure to form a bullish momentum before it is more secure.✔️
🤜If you like my analysis, please like 💖and share it💬
💕 Follow me so you don't miss out on any signals and analyze 💯

TRB To THE Moon! - 4 Hours No Talk! - BreakoutI am Already in.
Confident To Go Back To 65. Came Here After You Win! Do Follow! - Less Talk. Breakout!
Do Not Forget To Have a Exit Plan Too.
EnjoY.


$TRB Short We are in a pretty expensive price hence some whales might offload their bags.
We have MSS and the market going back to MSS-FVG during NY Killzone.

TRB/USDT Crucial Moment for TRB, What's the Next Move TRB ???💎 TRB is currently situated within a weekly resistance area, marking a pivotal moment for its trajectory.
💎 Examining past movements, TRB, just a week ago, experienced a substantial rejection at this level, plummeting 40% to reach a robust demand zone. Presently, TRB is retesting this weekly resistance area, following a notable rebound from the strong demand zone.
💎 A single confirmation is needed: a breakout of TRB through the weekly resistance and a daily candle closing above this resistance. If achieved, this area, once a formidable resistance, will transition into a support zone.
💎 Additionally, a prominent double bottom is visible on the chart, with the weekly resistance serving as the neckline for this pattern. A breakout in this area could effortlessly lead TRB to Target Profit 2.
Entry Strategies:
Spot Buy: Purchase post-TRB breakout and once the daily candle concludes above the weekly resistance area. This strategy is designed to circumvent false breakouts, necessitating a confirmation candle close.
Short Position: Await a bearish candle rejection within the 4h-12h timeframe and establish a short position. This position should be closed if TRB breaks out of the weekly resistance and the daily candle closes above it.

TELLOR $TRB follow up IdeaMore visual context regarding recent TELLOR idea.
Road to ATH!
BINANCE:TRBUSDT BYBIT:TRBUSDT.P MEXC:TRBUSDT.P OKX:TRBUSDT.P COINBASE:TRBUSD BINANCE:TRBUSD

TELLOR $TRB going to pop?TELLOR has been quiet for a couple of weeks after the massive pump it experienced. It has retraced down to $41 and been in a redistribution phase since and has levelled out somewhat. The structure still has bullish momentum being above the aug '22 high around $46, which was resistance. If it continues to hold this level and flips it into support, a further push can be expected. The heavy sell liquidity zone is between $64 and $80 (nov '21 high), therefore the market will likely push TRB up to either make a double top or a new high, potentially followed by a massive crash towards the lower sup zone around $30. If price manages to reach $80 and break above it'll be either wicked up and sold off hard, although that will likely happen before overcoming $80, so say it does get above the main resistance zone, then a parabolic move towards ATH at $165 is not far fetched, which would likely result in an aggressive 60-70% dump back to the new found support around $46. It may sound improbable but TRB only has a $125M marketcap making it prone to insane, almost irrational, value increases. The bearish outlook would be confirmed by break of bullish structure and price breaking below $41, this would send TRB into heavy demand zone around $24-$33. Potentially making a bottom there and/or moving sideways. I do not think a visit of $12-$13 is likely, at least in the short term. Marketcap would sink back to FWB:25M -30M, which is less than average daily volume traded in past 60 days. Considering all in all, TRB is going to provide ample opportunities in the short and medium term! Let's get it ;)
Most important level to break for bulls: $56
Most important level to break for bears: $41 - $43
TP bulls: $64 -> $80 -> $164 ((extended(ATH)
TP bears: $33 -> $24 -> 12.9
BINANCE:TRBUSDT BYBIT:TRBUSDT.P MEXC:TRBUSDT.P BINANCE:TRBUSDT.P OKX:TRBUSDT

TRBUSDT LONG!!!TRB LONG !!!!!!!!!!!!!!!!!
it will go up for the last time, then a sharp decrease is expected

TRB buying zoneIf BTC fail to hold this current price, with it's correction we can expect TRB to hit 35.5$ to 37$ which can be a good zone for long entry.

TRB#TRB
I will be short about this coin.
High probability that the coin will continue pumping. Last month it closed very bullish.
But, let me write you 2 possible scenarios.
If the coin continues it consolidation above 43$ - 46$ in this case, the retest of 64$ is possible (n.2)
If the coin closes with 1 H candle at around 43$ or below, in this case the coin will continue its downtrend towards to Green lines that I highlighted on the chart. On every level I would recommend to book your profits.

Falling Wedge in play while correction - Downtrend Falling Wedge in play while correction - Downtrend

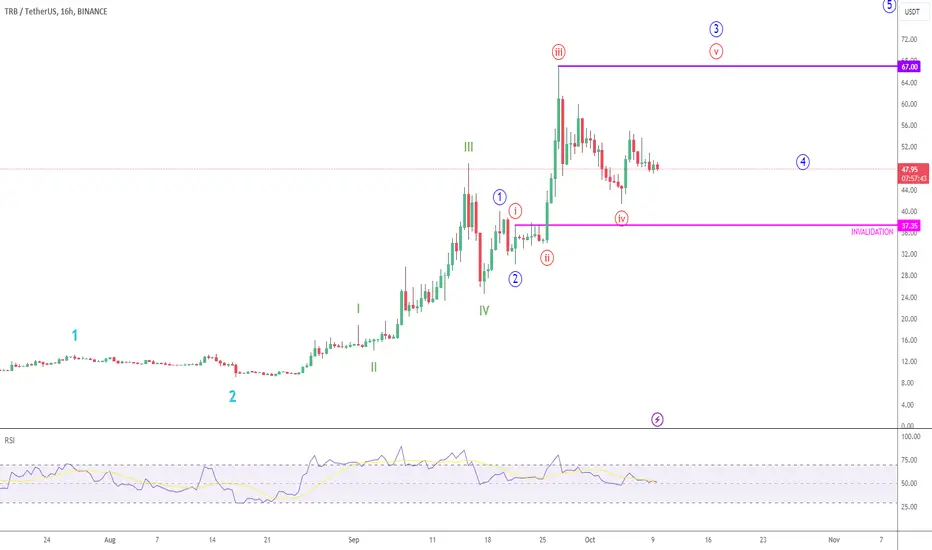
TRB 8H Chart Wave CountTellor´s solid upside move could still give traders interesting buying opportunities.
In my primary count, we´ve finished red wave iv, and a new high targeting 67 is expected.
Count is valid as long as we stay above red wave i high (at 37.35)
Continuation of ascending channelSynopsis:
There is a clear upward channel following Fibonacci zone. Currently the price is in the middle and shall go down, from where there should be either retracement to the top or breakout of the structure.
Entry: 43.944, Stop loss: 40.780, Target: 64.827, Duration: 4-6 days

TRB-USDTP trading idea My idea for TRB...looking for a retest of triangle before sweeping lows and moving on up

TRB's Epic Climb: A Trendline Trade You Can't Miss!Let's dive into the intriguing journey of TRB (Tellor) as it embarked on a remarkable climb. After reaching a peak in overbought territory on lower timeframes, the market dynamics began to shift. However, by employing a simple yet effective trendline analysis along with additional technical analysis, a compelling trade idea began to take shape.
The journey started with TRB displaying significant bullish momentum, surging to its highest levels in a while. Yet, as it ventured into overbought conditions on shorter timeframes, it became evident that a retracement or correction was likely on the horizon.
This is where a careful examination of the trendline came into play. By drawing a precise trendline, we were able to identify key levels of support and resistance. These critical zones provided a framework for assessing potential entry points and risk management.
Additionally, our analysis delved into various technical aspects, including oscillators, moving averages, and candlestick patterns, to confirm the trade's viability.
As a result, a well-defined trade entry opportunity emerged, capitalizing on TRB's price action and trend dynamics. By meticulously considering these elements, we aimed to maximize the potential for a successful trade while managing risk effectively.
Stay tuned for more updates on this exciting trade journey, as we navigate the ever-evolving crypto market together.

TRB BullishEntry: 48.3$ - 48.5$
SL: 47.4$
TP1 is the next purple top.
If the purple top is broken it will pump harder so fot TP2 tou decide yourself.
DYOR
Goodluck
