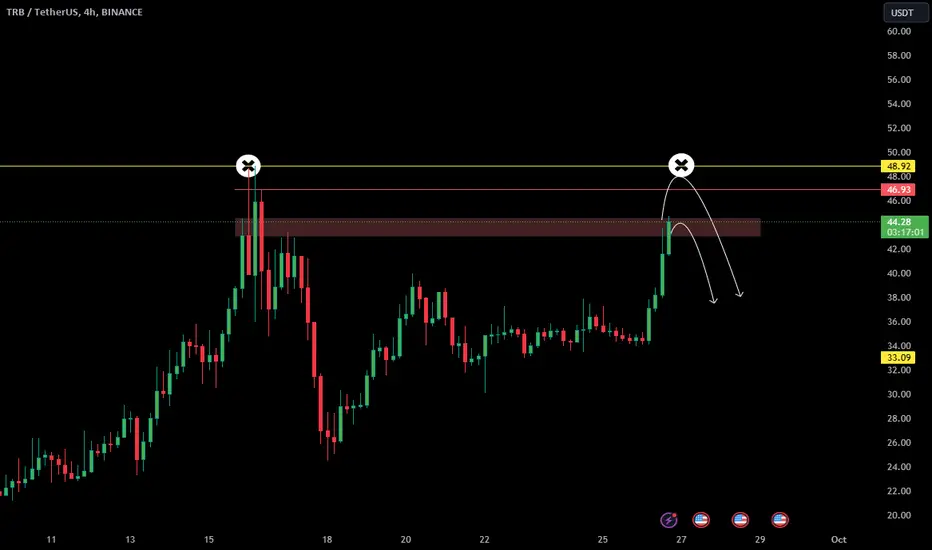
📊#TRB continues to rise, where are the possible target areas❓➡️The TRB experienced a brief correction after a sharp rise, and began to rebound after gaining support at a key support range. As I mentioned in the previous post, our near-term short target has been basically achieved, and we have also informed everyone to leave the market with all profits. 💰🍻
🧠 Now we have reached the short defense zone, and we have broken the short defense point of the small double top structure, if we can break the whole short defense zone, then we can go to the challenge high 💪🏻
Let's see👀
🤜If you like my analysis, please like 💖and share it💬
💕 Follow me so you don't miss out on any signals and analyze 💯
TRBUSDT trade ideas

TRBUSDT SHORT HARMONICSUsually the 1.618 ext. is the end of the Crab Harmonics, but because the 2.618 Fib time is so close, i'm thinking that after we reached these TR Pocket, we can see a reverse. My SL would be above the TOP, Main goal is on the 0.618 from the A point.

#TRB/USDT 5D (Binance Futures) Big descending wedge breakoutTellor Tributes printed a shooting star which probably marked the local top on that supply zone.
RSI is quite overbought, a retracement down to 200MA at least would make sense.
⚡️⚡️ #TRB/USDT ⚡️⚡️
Exchanges: ByBit USDT, Binance Futures
Signal Type: Regular (Short)
Leverage: Isolated (2.0X)
Amount: 4.7%
Current Price:
38.512
Entry Zone:
38.997 - 44.129
Take-Profit Targets:
1) 30.911
1) 22.890
1) 14.868
Stop Targets:
1) 50.476
Published By: @Zblaba
LSE:TRB BINANCE:TRBUSDT.P #Tellor #Tributes #Oracle #Web3 tellor.io
Risk/Reward= 1:1.2 | 1:2.1 | 1:3.0
Expected Profit= +51.3% | +89.9% | +128.5%
Possible Loss= -42.9%
Estimated Gaintime= 3-9 months


TRB shortBINANCE:TRBUSDT
i am personally short position in TRB, because it is fundamentally weak coin, i think this is fake pump and bull trap, top position should be 46$ but all bulls will be trapped when investors will get profit and sell coins, we can see this coin at its all time low ATL position in very near future, this is not a financial advise, trade at your own analysis

Bullish on $TRBWe just hit OTE and responded with bullish energy
We have draw on liquidity been monthly OB and its mean threshold (for tp purposes)
We had a whale buy a lot of TRB for midterm hold, if you check whale activity you would understand

After 2 Successfull Buy Trade on TRB here is The Third OneSTP Network is a blockchain-based platform that provides a standard for the tokenization of assets. The STP token (STPT) is the native cryptocurrency of the STP Network and is used to pay for transaction fees and to participate in governance.
Fundamental Analysis
The STP Network has a number of advantages over other tokenization platforms. First, it is based on a blockchain, which makes it secure and transparent. Second, it is scalable and can handle a large number of transactions. Third, it is flexible and can be used to tokenize a wide variety of assets.
The STP Network has a number of partnerships with leading companies in the financial industry. For example, STP has partnered with BNY Mellon to offer a tokenization solution for institutional investors. STP has also partnered with Nasdaq to develop a new stock exchange for digital securities.
Recent News
On September 26, 2023, STP Network announced that it had partnered with Metap Inc., a leading provider of digital asset custody solutions. This partnership will allow STP to offer its clients a secure and compliant way to store their digital assets.
On September 22, 2023, STP Network announced that it had been selected by the World Economic Forum to participate in its Blockchain for Social Impact initiative. This initiative aims to use blockchain technology to solve some of the world's most pressing social problems.
Disclaimer
Cryptocurrencies are volatile assets and prices can fluctuate wildly. It is important to do your own research before investing in any cryptocurrency.

#TRB/USDT Potential Double Top Pattern formation in 4-Hour TF!#TRB/USDT Potential Double Top Pattern formation in 4-Hour TF!
Rejected from PDH already. Breakout and retest above the resistance is bullish. LSE:TRB is looking good for Short.

TRB can reach 60 if break out1h time frame
-
TRB has been consolidating for 7 days, this consolidation structure is going to convergence as a triangle structure, which means TRB will appear volatility soon. If breaking out this triangle on upside, this pump momentum can be maintained.
TP: 59.5~65 / 88
SL: 22.3

TRB COIN PRICE ANALYSIS AND NEXT POSSIBLE MOVE !!LSE:TRB Coin Update & Possible Moves Near Me !!
• Almost on All Charts Look Overbought instead 1D Chart ( 1D Chart not Clear )
• You are able To Build position For Short with Tight Stoploss untill its price below 48$.
• RISK Level is High. Don't use High Fund.
Follow us for more analysis!!
TRB S4H OB touched, I'm beginning to build a short here. It started w 5M double top so maybe that's it

BUY IDEAWe got an ABCD pattern , we can wait for it to reach the 1.13 fibonnaci lvl.
PS: Never risk more than 2% per trade.

$TRB #TRB could explode ...Powerfull coin since 6 weeks already, Tellor could hava a big explosion at this level ...

TRBUSDTTRBUSDT is trading in fine bullish trend and maintaining well the bullish trendline.
Whenever the price retest the bullish trendline buyers are attacking aggressively, which can be seen from pointed arrows on the chart.
Currently the price is retracing to the inclining trendline and again it is being expected that the bulls are ready to attack.
if bulls take the charge this time too the next target could be 44.

TRB Trio: Multi-Position TradingA TRBUSDT trade setup can be broken down into three different trades, each with its own unique characteristics and potential outcomes:
1 - The initial trade suggests a short entry point, around 40.918. It's accompanied by a stop loss at 42.288 to limit potential losses and a profit level at 37.77 for your target gains.
2 - In the next trade, we entered with a position at an entry point of approximately 37.920. This trade presents an opportunity for growth as the take profit level is set at 49.52, while the stop loss is strategically placed at 35.382 to manage risk.
3 - Now, for the third trade, there are two entry points to consider: around 49.172 for the initial entry and approximately 53.50 for the second entry. The stop loss for this trade is set at 59 units, helping you mitigate potential downsides. If you wish to initiate a position, you can start at 49.172, and the take profit level will be set at 43.52, 35.30 and 28.88, offering a potential reward.
Remember that successful trading also involves effective risk management. Ensure you manage risk according to your portfolio's unique requirements and limitations.

$TRB #TRB pump might continueOn 4h time frame there is that $40 level to be cleared.
I think this week is decision time for Tellor

HOW-TO Use Nadaraya-Watson Envelope Improve SupertrendThe Nadaraya-Watson Envelope is a statistical technique used in finance and time series analysis. It is derived from the Nadaraya-Watson estimator, which is a non-parametric regression method.
In the context of the tradingview pine script provided, the Nadaraya-Watson Envelope is calculated based on the Volume Weighted Exponential Moving Average (VWEMA). The VWEMA is a type of moving average that takes into account both the price and volume of an asset. It is calculated by multiplying the closing price of the asset by its volume, then applying an exponential moving average to the result. This weighted moving average gives more importance to periods with higher trading volume.
The Nadaraya-Watson Envelope consists of an upper and lower envelope, which are calculated by applying a smoothing factor (alpha) to the standard deviation of the VWEMA. The standard deviation measures the volatility of the VWEMA, and the smoothing factor determines the width of the envelope. By adjusting the smoothing factor, traders can customize the sensitivity of the envelope to market conditions.
The Nadaraya-Watson Envelope can be used to identify potential overbought and oversold conditions in the market. When the price of an asset moves close to or beyond the upper envelope, it may indicate that the asset is overbought and due for a price correction. Conversely, when the price moves close to or below the lower envelope, it may indicate that the asset is oversold and due for a price rebound. Traders can use these signals to make informed decisions about buying or selling assets.
Additionally, the Nadaraya-Watson Envelope can be used to generate trading signals. For example, when the price crosses above the upper envelope, it may indicate a buy signal, suggesting that the price will continue to rise. Conversely, when the price crosses below the lower envelope, it may indicate a sell signal, suggesting that the price will continue to decline. Traders can use these signals in conjunction with other technical indicators and analysis to make well-informed trading decisions.
In summary, the Nadaraya-Watson Envelope is a powerful tool in technical analysis that combines the Volume Weighted Exponential Moving Average with upper and lower envelopes. It helps traders identify potential overbought and oversold conditions in the market and generate trading signals. By incorporating this technique into their analysis, traders can gain valuable insights into market dynamics and improve their trading strategies.
Supertrend is a popular technical indicator used to identify market trends and potential buy/sell signals. It combines the Nadaraya-Watson Envelope with other technical indicators to determine optimal entry and exit points in the market.
The principle behind the Supertrend indicator is to calculate the volatility and trend of prices using the Nadaraya-Watson Envelope. The Nadaraya-Watson Envelope creates upper and lower bands based on the statistical characteristics of price fluctuations. When the price touches or crosses the upper band, it suggests that the market may be overbought and a potential sell signal. Conversely, when the price touches or crosses the lower band, it indicates that the market may be oversold and a potential buy signal.
The advantage of using the Nadaraya-Watson Envelope to create the Supertrend indicator is its ability to capture long-term market trends while filtering out short-term noise. By considering the volatility of prices and statistical characteristics, the Nadaraya-Watson Envelope provides more accurate identification of overbought and oversold conditions, resulting in more reliable buy/sell signals.
The Supertrend indicator is widely applicable across various markets and timeframes. By combining the features of the Nadaraya-Watson Envelope with other technical indicators, traders can develop more effective trading strategies, improving their success rate and profitability.
In summary, the Nadaraya-Watson Envelope-based Supertrend indicator helps traders identify market trends and potential entry/exit points while filtering out short-term noise. It is a statistical analysis tool suitable for trading in various markets and timeframes.


TRBUSDT - Watch Closer - Most Probably Down by 8% in Next 48hTriangle Pattern Breakout Signals Bearish Move - Key Support Levels Identified
In the world of trading, it's crucial to keep a keen eye on technical indicators and patterns. In the 1-hour chart, a recent development has caught our attention: a triangle pattern that is poised to extend into new ranges. Notably, the 200-period Simple Moving Average (SMA) has been crossed by both the 30-period Exponential Moving Average (EMA) and the 10-period Moving Average (MA). This crossover indicates a significant shift in market sentiment, pointing towards a potential bearish phase.
Let's break down the key factors driving this analysis:
1. Triangle Pattern Breakout
The triangle pattern is a well-known chart formation that typically signifies a period of consolidation followed by a potential breakout. In this case, the breakout appears to be in the downward direction, indicating bearish sentiment in the market.
2. Moving Average Crossover
The 200 SMA being crossed by both the 30 EMA and the 10 MA is a strong bearish signal. It suggests that short-term momentum is aligning with the longer-term trend, reinforcing the bearish outlook.
3. Bearish Range
With these technical indicators in mind, we're looking at the initiation of a bearish phase on the chart. Traders should be cautious and consider short positions or protective measures as the market sentiment appears to favor the downside.
4. Key Support Levels:
In any trading scenario, identifying support levels is crucial for risk management. We've pinpointed three important support levels:
S1: 25.83
S2: 20.23
S3: 17.65
Keep a close watch on these levels, as they could serve as potential bounce points or areas of increased selling pressure. Traders may want to set stop-loss orders and take-profit targets accordingly.
As always, remember that trading involves risk, and it's essential to have a well-thought-out strategy and risk management plan in place. The combination of the triangle pattern breakout, moving average crossovers, and identified support levels presents a compelling trading opportunity in the bearish direction. However, it's advisable to perform additional analysis, consider market conditions, and factor in your risk tolerance before executing any trades. Happy and cautious trading! 📉💼
Financial Disclaimer
The information presented is for informational purposes only and should not be considered as financial or investment advice. It does not constitute a recommendation to buy, sell, or hold any financial instruments. All investments carry inherent risks, and past performance is not indicative of future results. Before making any financial decisions, conduct thorough research, assess your individual financial situation and objectives, and consult a qualified financial advisor. The financial markets are subject to volatility, and prices can change rapidly and unpredictably. Any actions taken based on the information provided are at your own risk, and we bear no responsibility for resulting losses or damages. Additionally, please note that financial regulations and market conditions may vary by region, so compliance with local rules and regulations is crucial.


TRBUSDTBINANCE:TRBUSDT SELL IDEA
⛔"Daily crypto market analyses I provide are personal opinions & not financial advice. Trading carries risks, so do your own research & seek advisor's help.#DYOR"
Don't forget to like and comment

📊#TRB may turn lower through a double top structure📉🍻We are glad that the bears have successfully defended, we have now formed a big double top and a small double top respectively, and may end the short-term rally with wave 5. Now we need to wait for the key support line to be broken to confirm the start of the turn.📉
🧠As long as our short defense point 1 is not broken, then there is still a possibility of turning down, we will generally put SL here. Of course, if you want to make R/R more beautiful, you can put SL in the position of short defense point 2. But it's also easy to sweep away, so set it to your liking.⚙️
🤝I am also very happy to receive your comments and support. Thank you.❤️
➡️The reason why I publish the details of this trading strategy is to review myself, so that I will not make such mistakes in the future and improve my service level.✔️
➡️Second, to remind you not to make this mistake, this was a wrong demonstration, although we were able to make a profit again.😂
👉As the fan commented in the comments, the longer we waited, the more money we had to pay, but fortunately we were light and had a 128% return on target 1, which would have been a staggering 460% or so if we had achieved all our targets🤩💰
Well, let's see if we can accomplish our goal👀
🤜If you like my analysis, please like 💖and share it💬
➡️If you can't grasp the rhythm of futures trading, please follow my footsteps and print money together.
💕 Follow me so you don't miss out on any signals and analyze 💯

TRB retracing after a run up5 wave structure completed, now maybe a 3 wave corrective structure down.
Caught a short earlier and hoping to ride this down to 32.
FOMC looming in 2 hrs so have moved stop to entry and set TP. Will look to enter a long tomorrow.
