TRBUSDT | BULLS CONTROLTRB has been trading with in a channel
The price has been converged and finally broken above the channel.
The bulls need to hold above the channel for further upside trend.
Manage your trades accordingly.
TRBUSDT trade ideas

$TRB #TRB | LTF LONGIf the price passes red line, I expect price visits to upper levels like 15.2 & 15.4.
If the price closes below 14.44 , I expect price visits to lower levels like 13.8.
For short-term trading: Focus on 14.17 & 14.21.
Have a nice week!

TRB LONG Trade 20221225Head-Shoulder Bottom
Need a valid breakout
Risk Reward: 5
DISCLAIMER
This is only a personal opinion and does NOT serve as investing NOR trading advice.
Please make your own decisions and be responsible for your own investing and trading Activities.

#TRB See the big picture! We are still in manipulation process. Breaks very sooon. Keep waiting. UP!

TRBUSDTHello Crypto Lovers,
Mars Signals team wishes you high profits.
This is a 4-hour-time frame analysis for TRBUSDT
As you see, R2 and R1 used to be support areas at the top of the chart and S1 and S2 are our support areas in which the support of price at several points is clear. Currently, we have the fluctuation of price over S1 after its decline to this area and we expect it to reach S1 via its falling trend. Here we would have two scenarios. One of them is providing some rising signs by the price and certainly an increase is waiting for it up to R1 or higher. The other event is related to the rejection of price at S1 which causes more fall to lower amounts. If you are looking for more logical and less risky trades, we suggest you our updates and precise analyses in this regard.
Warning: This is just a suggestion and we do not guarantee profits. We advise you to analyze the chart before opening any positions.
Wish you luck

TRB - this will grow. Warning!Hi, I think TRB made double bottom and now its time for long. We have clear breakout and new accumulation stage. After the breakout there is as well crazy shooting star candle so the price wants to go higher. Good luck!

BABA ALWAYS RIGHT: TRBUSDT WILL DOWN TO 12 AND BELOWBABA ALWAYS RIGHT: TRB WILL DOWN TO 12 AND BELOW after reaching 14.3 (already achieved)....
very unstable... over bought... wavy curve very bearish as of now....
sell sell sell....

TRB LOOKS BULLISHI hope you are fine .
TRB seems to be laying the groundwork for the climb, although the climb may not be big. A structural change is seen in the lower time frame.
Don't forget leverage and stop setting while buying capital management
Comment if you have any questions
Thank You

TRBUSDT | RISING WEDGETRBUSDT has been in a bullish trend .
The bullish trend is well respected by rising wedge .
The price is currently at upper boundary of wedge .
The bears can show momentum at this zone.
Manage your trades accordingly.

TRB SHORT SETUPNote, this analysis is not a buy/long setup but a sell/short setup. If it reaches a limit, we will enter, if we reach a limit that
Today we have a setup to SELL/SHORT the TRB symbol.
For risk management, please don't forget stop loss and capital management
When we reach the first target, save some profit and then change the stop to entry
Comment if you have any questions
Thank You

TRBUSDT | SUPPORT ZONETRBUSDT has been trading in a bearish trend . The price has been making lower lows and lower highs.
Now after breaking some major support, price has approached to horizontal support zone .
The bulls can take control from here.
Manage your levels accordingly.

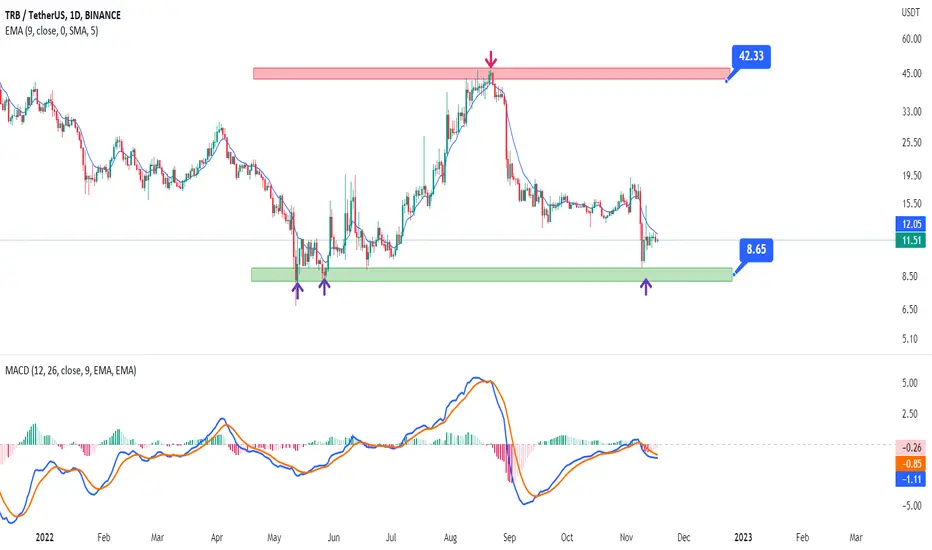
TRB On the way to climbThe trb currency is being compressed in the daily time frame, if the ema9 indicator is placed under the candles, it will easily move to the range of 42.23, provided that the macd indicator gives a buy signal.
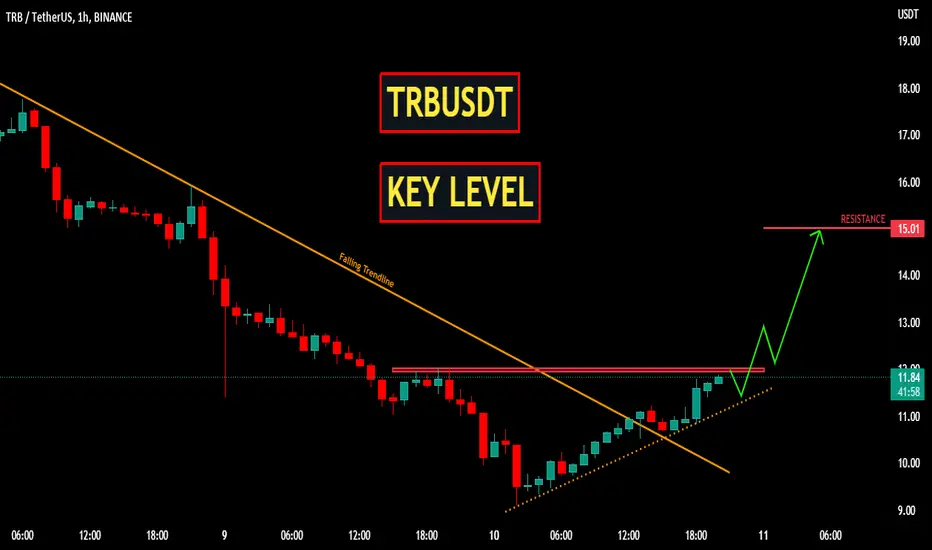
TRBUSDT | KEY LEVELTRBUSDT has been trading under the falling resistance.
The price approached to the support zone multiple time and bulls hold the support zone .
Now the price has broken above the falling resistance.
The bulls can push the price higher from breakout level.
Manage your trades accordingly.
#TRB $100#TRB Is forming huge divergences at 1W 2W 3W and Monthly Timeframe,
Low cap
It's on the road to ATH

Updating highs on volumes. Good setup!1h TF. The coin today is in the top in terms of activity + on good volumes.
I consider the impulse breakdown of the level after the formation of local trading in the vicinity of the level.
Enter the breakdown of the local level and from the activity in the order book!

TRB Very BullishHello good time
I think this currency is very bullish. We have a structural failure. Also, the strength and volume of buyers is also high.
Good correction.
Comment if you have any questions
Thank You

#TRB to 50$?Hello dear Traders,
Here is my idea for #TRB
Price triggered yellow line (previous month high)
Targets marked in the chart (black lines)
Invalidation level marked with red line
Good luck!
❤️Please feel free to ask any question in comments. I will try to answer all! Thank you.
Please, support my work with like, thank you!❤️

TRBUSDT | BULLS READYTRBUSDT after hitting a top at 45 has been trading in downtrend, The price has approached to the strong horizontal support zone The bulls took control from support zone . The broken rising support now acts as resistance. The price has been trading in range. The price need to broke above the resistance.
Manage your trades accordingly.

TRB LONG (Day Trade)I like TRB here.
I longed TRB with only a small position since BTC still unstable.
Risky play so only use small margin.

TRB CAN GO UPPERI think this currency has the ability to rise. Static and dynamic resistances have been broken. Do not trade without setting stop and capital management

TRBUSD BUY TRADETRBUSDT 4H PROJECTION
BUY TRADE
TRADE CONFLUENCES
1. Wyckoff accumulation phase
2. Anticipating rally after LPS to show sign of strength
3. Imabalances as target

Buy TRB I would recommend you to take my words for it because as I said in my other published idea, the market is going as I predicted 🔥🔥.Take your profit and don't be greedy, let see how the market goes. Good luck!

TRBUSDT | WATCHOUT ZONETRBUSDT after hitting a top at 45 has been trading in downtrend, The price has approached to the strong horizontal support zone . The bulls took control from support zone. The broken rising support now acts as resistance. The price has been trading in range. The price need to broke above the resistance.
Manage your trades accordingly.
