TRBUSDT trade ideas


TRB possible bullish read description.TRB has bullish signs. Enter at $ 63, Stop at $ 58. Sounds pretty good, let me explain why.
First of all TRB already had the 9 bass sequences and sounds ready for a Bullish
Second, the bears are losing strength.
MACD:
This means that the bears are losing steam. And that the indicators are trying to turn bullish. Taking a range of the possible raise. We could see TRB at $ 120. With a little ease.
Although we must bear in mind that we are going against the current trend of the entire market that is bearish. But it is certainly worth the risk. Let me tell you my plan on Futures.
In the BTC pair it also sounds bullish.
Entry: 59-65 USDT
Stop: 57 USDT.
Target: 120 USDT.
Leveraged: 5x.
Please share my ideas and Like. Thanks for you.


Messy looking of TRBMy apologize it looks so messy . TRB looks bullish from the last dump I saw pumping candles which means someone is collecting people's stuff. With a correction of BTC it might retest 70ish area then a strong pump through 100+ It's an oracle so if Link doubled it why TRB can't ?

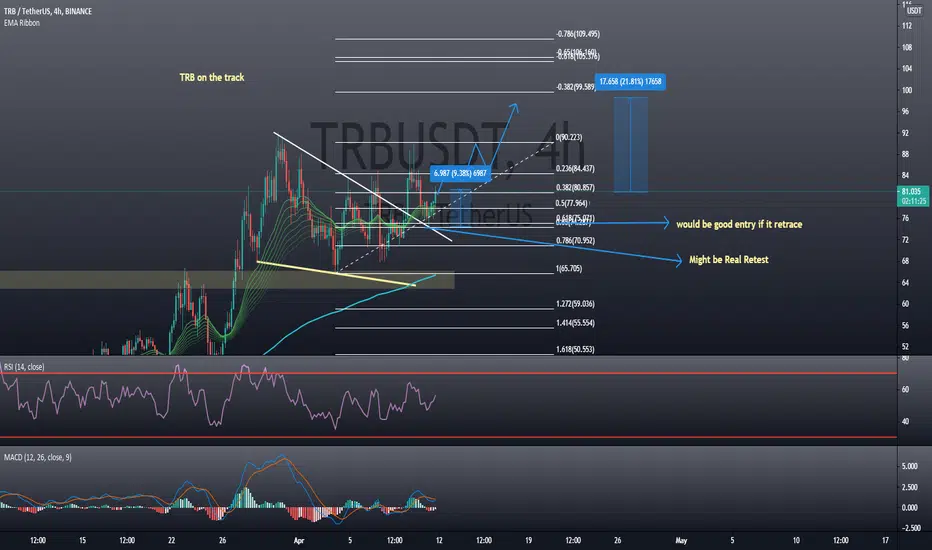
TRB/USDT Long maybeHi guys, Here's a quick look at TRB/USDT 4H chart. As we can see, we bounced from Fib 0.216 Support Level we made a good triangle, and if we break out this triangle we might see a new ATH. 4H Macd is still negative we might see 1 more retest before going higher depends on BTC as well. We might need more volume and hype.
My targets are:
1. 81.3$
2. 86.7$
3.92.3$
4.100$
5.110$
6.124$
These are my targets if we breakout strongly with good volume with good bounce.
Trade Safely
This is not financial advice! Just my idea about TRB!
Do your own research.
If do you see a mistake or want to help, you can write in the comments.
It's my first time so take your own risk.
Not investment advice.
My ideas are only helpful and not advice to buy or sell, you are the decision-maker.


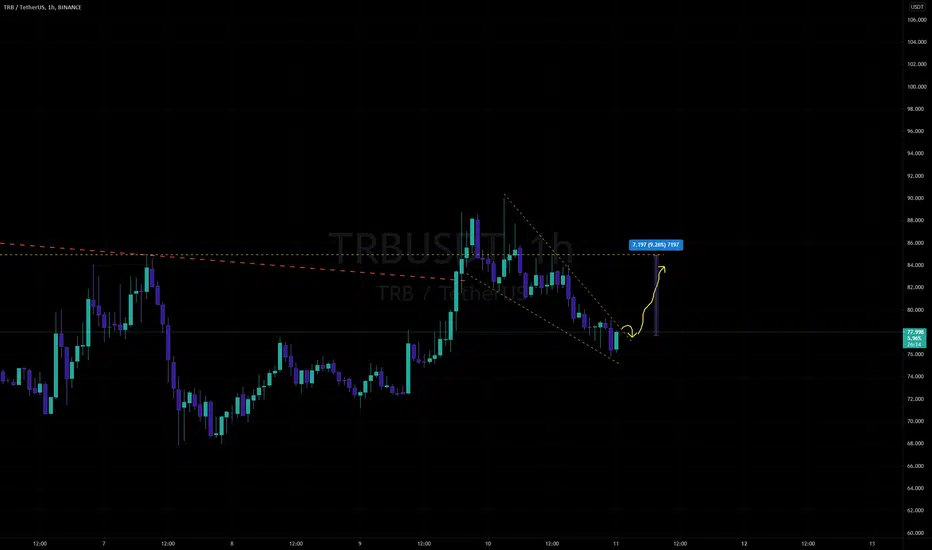
TRBUSDTHello to you all. Mars Signals team wishes you high profits at all times.
We feel that in the 1 hour time frame, the pattern is flagged. If it leaves the channel, it will touch the above targets over time.
Warning: This is just a suggestion to you and we do not guarantee profits.
Wish you luck!


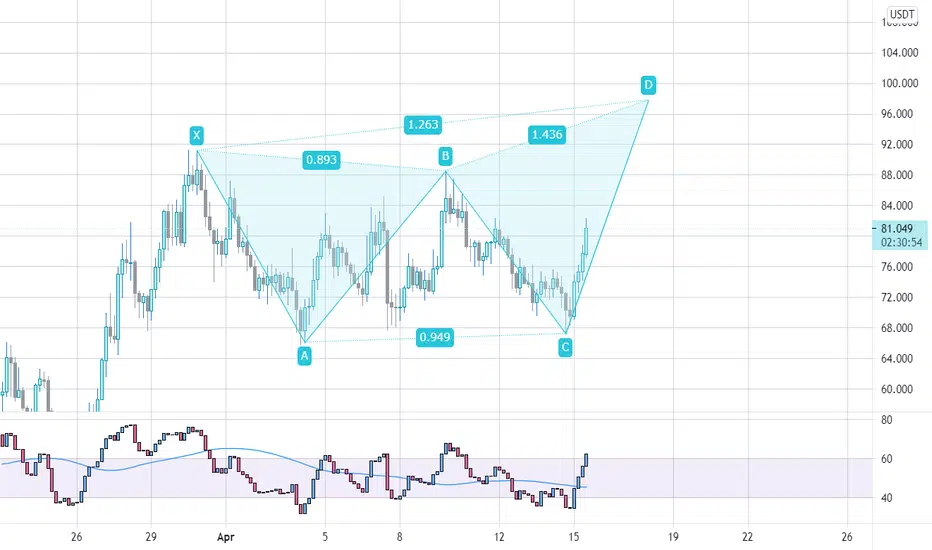
🆓Tellor/USDT Analysis (15/4) #TRB $TRBTRB has just conquered the 80$ zone and the buying volume is quite strong so we can expect it will keep moving up to 110$ and 140$ in the next few days
But if it loses the 70$ zone, it will have a big decline to 50$ zone
📈BUY
-Buy: 76-80$. SL B
📉SELL
-Sell: 107-113$. SL A
-Sell: 137-143$. SL A
♻️BACK-UP
-Sell: 76-80$ if B 70$. SL A
-Buy: 48-52$. SL B
❓Details
Condition A : "If 12H candle closes ABOVE this zone"
Condition B : "If 12H candle closes BELOW this zone"


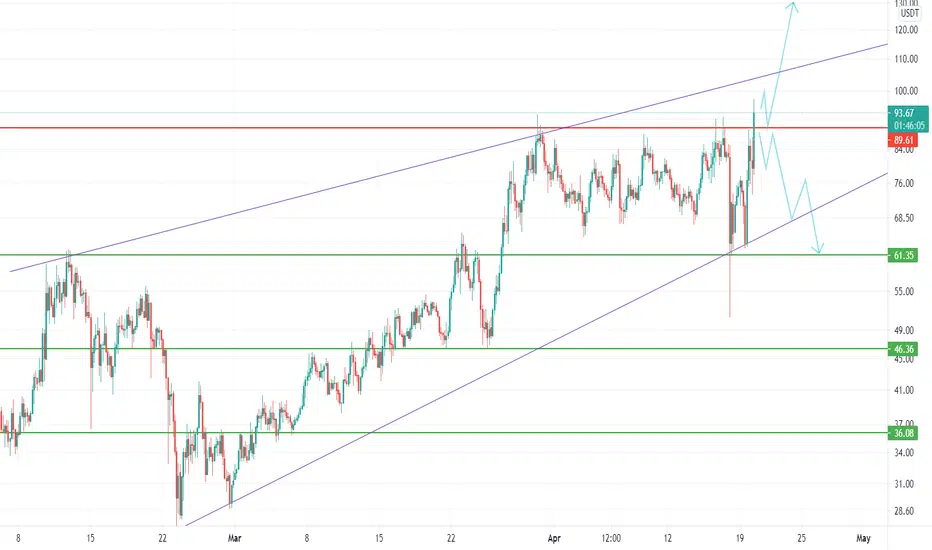
TRBUSDT is creating a descending channel on weekly support 🦐TRBUSDT is creating a descending channel on weekly support. IF the price will have a breakout from the channel, According to Plancton's strategy (check our Academy), we can set a nice order
–––––
Follow the Shrimp 🦐
Keep in mind.
🟣 Purple structure -> Monthly structure.
🔴 Red structure -> Weekly structure.
🔵 Blue structure -> Daily structure.
🟡 Yellow structure -> 4h structure.
⚫️ Black structure -> <4h structure.
Here is the Plancton0618 technical analysis, please comment below if you have any question.
The ENTRY in the market will be taken only if the condition of the Plancton0618 strategy will trigger.