TRX it is time! Big breakout coming! $.09 soon.Trx is showing huge up side here in the near future. I have listed three targets for Tron! Although I have a daily chart shown I have been looking at different timelines as well. This is what I see: We have weekly bullish Divergence, we have a daily double bottom and we have a 4hr cup and handle forming. TRX is ready to make some serious gains. Don’t miss this opportunity!
TRONUSD trade ideas

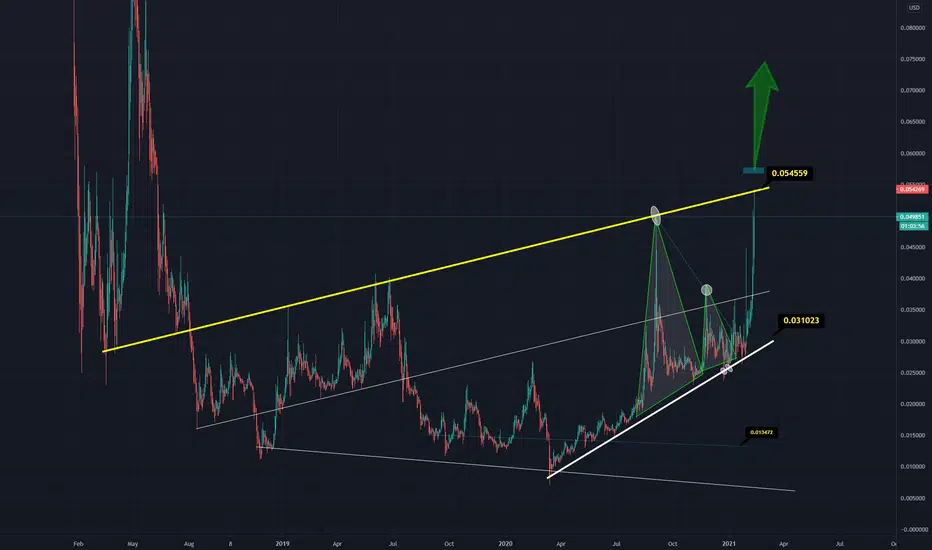
TRX USD broken above key level, looks set to run highAfter recent price spike (After Justin Sun Tweet on Doge/TRX) Tron which has been accumulating over a long period looks set to pump. The price has broken above a key level and I expect it to move upward in the range of 30-50% in the next few weeks. This is fairly conservative and it could easily move higher.
This is not financial advise

TRON - also out until resistance can be brokenSame like Litecoin , hitting major resistance today... Makes me think if a correction is incoming? Sideways maybe for a while, or a drop??
In any case i always listen to my chart: I am out of Tron until the resistance can be broken.
Prefer to place more on Stellar and Cardano at this stage.
TRX growth incomingTRX looking to bounce between resistance and support of $0. 05 and $0.04. Breakout in coming weeks
Short-Term
Timeframe: 1-3 weeks
Possible Gains short term:10%
Long-term
Timeframe: 2 - 3 months
Possible Gains long term: 15-50%
Position
TRX: 5541
AC: $0.049
Target 1: 0.06
Target 2: 0.07
This is just my view and information for me to track. Do what you will with the information!

TRX NEW RALLY AND TARGETSif this currency break yellow pivot it will go for lvel 1 and 1.27 of extention fibonacci

TRXUSD: What are you waiting for?I don't know what to say! This is far valuable ten DIAMOND! When you but Tron, you actually hire Justin! This young talented man is working for you. He has demonstrated his excellency. When you sell Tron you fire him! Right?
I do not know of any RICH TRADER! I do know of RICH INVESTORS. One cannot ride on all market's waves. You get nervous & repeatedly can make horrible mistakes. Money precipitates in different assets OVER TIME. Forget about Noises, Pumps, Dumps, NEWS specially & rumor.
Learn, Learn, Try Cautiously, Step In INVESTMENT gradually - BUY/SELL (at Different TIMES & Different PRICES). Do not rush into/out of doing anything all at once. Drink your coffee, think your Winning Plan (BUY/SELL Times, Prices, Portfolio, etc.) - Devise YOUR OWN STRATEGY, and do not mimic any other person.
Once upon a time I thought Trading is about IQ! I thought I am so smart! Now I am WISE! I do believe now that not only Trading, but also all other things, are about IQ, EQ & LQ and these 3 are cannot be separated. In my greedy dummy search for more & more money I crashed MYSELF, I overlooked/look down on others. I have lost MY LOVE Quotient! I have got no share of LOVE!
These are much more important than comparing some dummy numbers of some more or less percentages & getting nervous why I couldn't buy this or that. Think about your VISION, your life MISSION. Think about the poor, those who need your BEING & not your money. Think about what really matters to make a better environment & life for everybody. Give LIGHT of love & passion to your neighbors, and your own house will be brighter.
I could not miss sharing the IDEA of TRY to BE MORE HUMAN. It is a reminder to myself first & last. I do love Trading. Yet I must love MYSELF & PEOPLE first & ever.
Sorry for elongating the words. Wish you best of the bests in life & career.

TRX can grow up after breakout resistance !Resistance 0.055
Support 0.03
Targets 0.075 - 0.1
forexness

TRX macro view, bullish.Trx has been lagging behind the majors for some time now.
If you bought trx everytime it hit the white ascending line beginning March 2020 you would be in very good profit.
I have a bag and have been accumulating for some time now .
I expect this to run as soon as we flip the $0.5 area.


TRON about to surprise the crypto marketTron double bottom formation neckline currently undergoing breakout. A weekly close above neckline would interest more buyers. Watch out!

TRX TRON 10022021after long consolidation.. trx finally break 0.038 and 0.042 resistance.
both level will act as strong support.
next resistance is 0.05 , then 0.06.


TRX/USD - Tron towards $9 cents! 🚀🚀🚀Tron broke out of its range and now is pushing higher fast.
We have one more resistance before we are clear to go to $9 cents. The momentum looks strong enough to make this quite likely and soon.
The indicators are extremely bullish and particularly on weekly timeframe we have a beautiful positive cross on MACD that will surely lead us into a great rally that can take us much higher than $9 cents.
Good to explore longs as soon as we break this resistance line and we confirm it as support.
Trade safe!
Like and follow if you liked this idea! Also join my crypto community to stay in touch!

TRON - Good run but resistance incoming!Tron has had a good run the last week and especially today, with great news playing a significant role.
Unfortunately for my Tron lover audience, this run is very likely coming to an end...
0.53 is a strong resistance level
