Phemex Analysis #76: Pro Tips for Trading the TRUMP Rally!The TRUMP token ( PHEMEX:TRUMPUSDT.P ) has recently experienced a surge in value, with a 60% increase, fueled by news of President Donald Trump inviting the top 220 token holders to a dinner on May 22nd. Additionally, the top 25 holders are reportedly invited to a private event and tour at the White House. These exclusive events have generated significant excitement and speculation within the market, driving increased trading volume and price appreciation. This analysis will explore the potential scenarios for TRUMP token's price action in the short to medium term.
Possible Scenarios
1. Hype-Driven Rally Continuation
The current rally is largely driven by hype and speculation surrounding the upcoming events. If this momentum continues, TRUMP token could see further short-term price increases.
Pro Tips:
Monitor social media sentiment and trading volume for signs of continued hype.
Identify key resistance levels that the price may test, such as $17, $24 & $30.
Consider taking profits on short-term long positions as the event date (May 2nd) approaches.
Implement a trailing stop-loss to protect profits while staying in the trend.
2. Post-Event Sell-Off
It is common for the price of an asset to decline after a major event, as the initial excitement fades. This is a potential risk for TRUMP token following the May 22nd dinner.
Pro Tips:
Be prepared for a potential "sell-the-news" event.
Tighten stop-loss orders or consider exiting long positions before the event.
Consider shorting opportunities if the price breaks below key support levels following the event, but manage risk.
3. Consolidation and Long-Term Value Assessment
After the initial volatility, TRUMP token's price may consolidate as the market attempts to determine its intrinsic value. This consolidation phase could be influenced by factors beyond the immediate hype.
Pro Tips:
Identify the consolidation range and trade accordingly, buying low and selling high within the range.
Assess the token's long-term viability and adoption potential.
Be cautious about long-term positions until the consolidation phase resolves.
Conclusion
The upcoming events involving President Trump have introduced a significant element of hype into the TRUMP token market, leading to a rapid price increase. Traders should be aware of the potential for both continued short-term gains and a post-event sell-off. It is crucial to monitor market sentiment, volume, and price action closely. By employing appropriate risk management strategies and considering the token's long-term fundamentals, traders can navigate the volatility and make informed decisions.
Pro Tips:
Elevate Your Trading Game with Phemex. Experience unparalleled flexibility with features like multiple watchlists, basket orders, and real-time adjustments to strategy orders. Our USDT-based scaled orders give you precise control over your risk, while iceberg orders provide stealthy execution.
Disclaimer: This is NOT financial or investment advice. Please conduct your own research (DYOR). Phemex is not responsible, directly or indirectly, for any damage or loss incurred or claimed to be caused by or in association with the use of or reliance on any content, goods, or services mentioned in this article.
TRUMPOFFICIALUSDT.P trade ideas

$TRUMP is waking up!$TRUMP is waking up! 🚀
Just broke out of a falling wedge on the daily timeframe with solid volume.
A 150% upside move is now in play if momentum continues. This could be the start of something big!
Watch closely — this setup looks 🔥
DYOR, NFA


Trump clean sweepTrump rose to 55% after our Fbuy print. That's the specialty of 7-star buy and sell. Enter the right coin at the right time.
You can drop a message for indicator access.
DYOR

TRUMP - Dead cat bounce?TRUMP looks like a typical dead cat bounce, acquiring major short squeeze getting bonked and probably a dead cat bounce. Plan at 18.21

TRUMP/USDT 4-2025🚀 TRUMP/USDT - Accumulation Holding Zone 📊 – TRUMP has spent 13 days holding the weekly low around $7, showing strong resilience—even after a major unlock event (~20% of circulating supply). This price action suggests potential accumulation, and if the $7 level continues to hold, an upward movement may follow.
Breakout Targets:
$9.5 🟢 (TP1)
$10.5 🟢 (TP2)
$12.5 🟢 (TP3)
Panic Key (SL):
Daily or weekly close below $7 🔻 (Invalidation of this bullish view)
Note:
This is not financial advice but a reading of market structure and price behavior. Always do your own research and manage your risk.
We ask Allah to reconcile and repay. 🙏

Weekly trading plan for TRUMPMarked the important levels in this video for this week and considered a few scenarios of price performance.
Write a comment with your coins & hit the like button, and I will make an analysis for you
The author's opinion may differ from yours,
Consider your risks.
Wish you successful trades! MURA

trump coin new outlook according to H4 analysis TRUMP coin is almost at support level so if you want then go long from support level
TRADE AT YOUR OWN RISK

TRUMP COIN WILL FLY SOON trump coin new outlook
according to H4 analysis trump coin is in falling pressure from last few days
now it will be lyu from support zone
so if you want then go long from support
TRADE AT YOUR OWN RISK
REGARD ALBERT

$TRUMP LONG $TRUMP 4H LONG
The asset retains a pronounced upward dynamics, which opens opportunities to consider long positions.
The expected test of the designated zone of interest (POI) may act as a trigger for the continuation of the upward momentum.
Target benchmarks: $8.71, $8.85, $9.09, $9.64.

TRUMPUSDT 12HTRUMP ~ 12H Analysis
#TRUMP Buy gradually from here with a short -term target of at least 10%+ from here. We think this will be an area of whale accumulation

Right out of the Meme Coin HandbookJust further reinforcing my opinion $5 is the bottom for Trump coin. The BONK fractal continues to reflect TRUMP. If I am correct this will result is a fairly dramatic fall very soon to under $6. At that point I'll be backing up the truck.

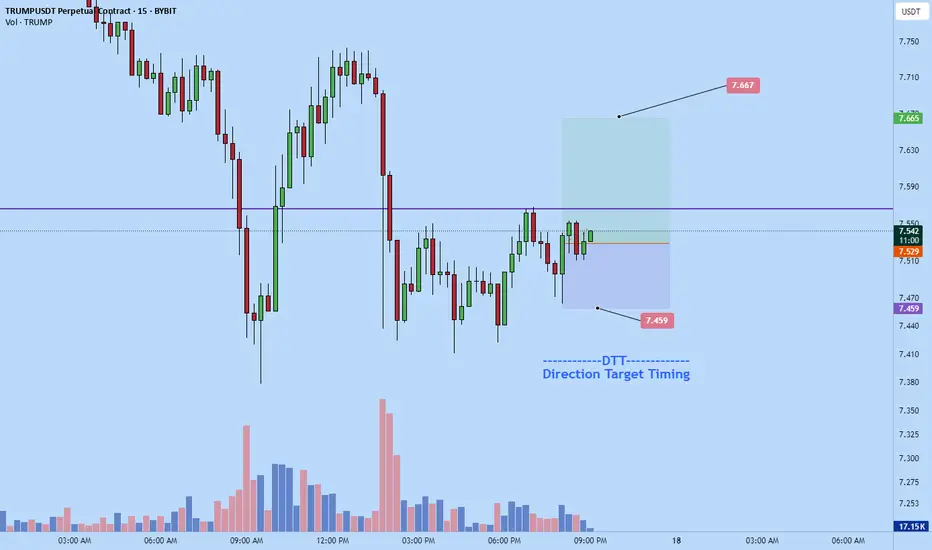
Trumpcoin longJust now went long on Trumpcoin. Targeting $7.667 area
Scalp long.
Let's see how it goes.

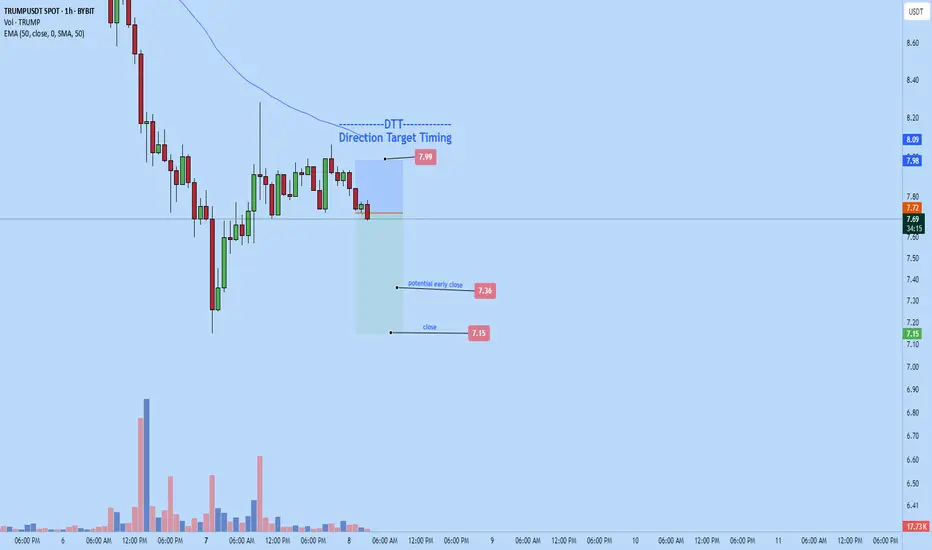
Trumpusdt short now !Just now opened a short position on Trumpusdt.
Anticipate 7.875 price target or lower today

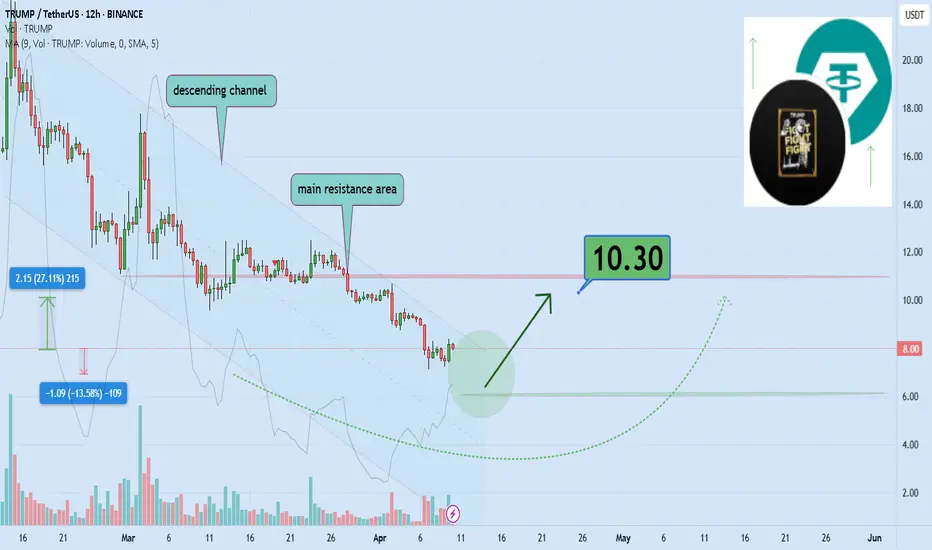
Trump's official hits $8—25% bounce expected to $10.30 soonHello and greetings to all the crypto enthusiasts, ✌
All previous targets were nailed ✅! Now, let’s dive into a full analysis of the upcoming price potential for Trump's official 🔍📈.
In recent months, Trump's official has undergone a sharp and unusually volatile decline—a move I had anticipated with precision, projecting the drop to the $8 level. While further downside risk cannot be ruled out, I currently expect a short-term technical rebound, potentially offering a minimum upside of 25%, with a near-term target around $10.30. This scenario reflects a tactical opportunity amid broader bearish momentum.📚🙌
🧨 Our team's main opinion is: 🧨
Trump's official plunged just as I predicted to $8, and while more downside’s possible, I’m eyeing a short-term bounce toward $10.30—about 25% upside.📚🎇
Give me some energy !!
✨We invest hours crafting valuable ideas, and your support means everything—feel free to ask questions in the comments! 😊💬
Cheers, Mad Whale. 🐋
Its CHINA vs TRUMPDont know about the tarrifs, but this has a %500 tarriff and is going to get wrecked again!


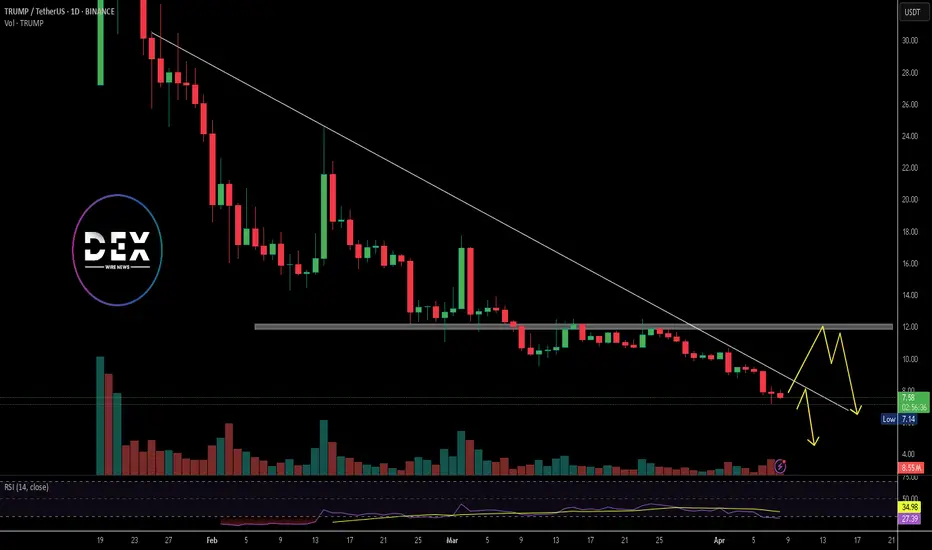
$TRUMP token Crumbles as Major Support Breaks, Is an ATL Next? TRUMP, the meme token inspired by former President Donald Trump, is currently priced at $7.52. The token has gained 5.03% in the last 24 hours. Its market capitalization stands at $1.5 billion, with a daily trading volume of $415.5 million, a drop of nearly 60.12% in the last 24 hours.
TRUMP was launched to commemorate Trump’s viral "FIGHT FIGHT FIGHT" moment in July 2024. That day, he survived a deadly incident and raised his fist in defiance. The moment triggered a movement that birthed this meme token. It symbolizes resilience and leadership, attracting thousands to its growing community. The token is now freely tradable on the blockchain, with increasing interest in both trading and long-term holding.
Technical Analysis: Price Faces Trendline Rejection and Heavy Resistance
TRUMP has been in a strong downtrend since reaching highs at $77. A descending trendline continues to cap upward moves, with the price breaking below key support at$12. Resistance is seen around the descending trendline and the horizontal support at $12. This level was previously a support and is now acting as a ceiling for price recovery. The daily RSI is currently at 27.19 indicating oversold conditions. This could trigger a short-term bounce toward $10–$12.
However, the trend remains bearish. The price has failed multiple times to break above the downtrend line. If the price breaks below $7 with volume, further drop could follow. A successful bounce might lead to a retest of $12.
TRUMPHello friends
Due to the price drop, we reached a good support area where good buyers supported the price.
Now we can buy in steps and with capital management in the specified support areas and move to the specified targets.
Always buy in fear and sell in greed.
*Trade safely with us*

#TRUMP USDTEvery high is an opportunity to get out, don't miss the opportunity to buy at low prices
Don't rush to buy, soon the prices of all coins will return to where they started.
Do not trade futures in this market at all, only spot

Will Trump's break resistance or drop 26% to $8?Hello and greetings to all the crypto enthusiasts, ✌
All previous targets were nailed ✅! Now, let’s dive into a full analysis of the upcoming price potential for Trump's official 🔍📈.
Trump's official is currently positioned at the upper boundary of its descending channel. Based on technical analysis, I anticipate a further decline of at least 26%, with a target price of $8. A significant resistance level has been identified and marked on the chart. If the stock fails to break above this resistance, the downward trend is likely to continue. Investors should closely monitor price action for confirmation before making trading decisions.📚🙌
🧨 Our team's main opinion is: 🧨
Trump's stock is hitting key resistance in a downtrend, with a likely 26% drop ahead and an $8 target if it doesn’t break higher.📚🎇
Give me some energy !!
✨We invest hours crafting valuable ideas, and your support means everything—feel free to ask questions in the comments! 😊💬
Cheers, Mad Whale. 🐋
