#TRUMPUSDT — Breakdown or Reversal Confirmation🚀 BYBIT:TRUMPUSDT.P — Breakdown or Reversal Confirmation? Full Breakdown on 1H & 4H!
Let’s start by analyzing the charts on different timeframes:
✅ On the 1H chart , we clearly see a reversal pattern — Inverted Head & Shoulders — and the neckline breakout has already occurred. The volume on the breakout is high, which confirms the strength of the signal.
➡️ The target for this pattern is around $10.75–$10.80, which also aligns with the upper VPOC level from the previous range.
➡️ The POC level for BYBIT:TRUMPUSDT.P is $10.159, which may now act as support — this can be a potential entry zone.
➡️ Nearest resistance is at $10.40. A breakout above this level could trigger an impulse move towards $10.75–$10.80.
✅ On the 4H chart , a bearish flag is forming, which could potentially push the price lower — but this scenario hasn't played out yet.
➡️ There's also a local double bottom, confirmed by a price bounce. A retest of the flag’s lower boundary will be a key moment.
Let’s break down the patterns:
✅ 1. Inverted Head & Shoulders (1H) – A classic bottom reversal formation.
➡️ The neckline breakout occurred on increased volume — a key confirmation for a long setup.
✅ 2. Volume (Volume Profile & Bars) – Strong volume spike during the breakout confirms buyer interest.
✅ 3. Price broke out of consolidation – We’ve seen an impulsive breakout and the price is holding above the neckline.
✅ 4. Local Market Structure Break (MSB) – A shift from local downtrend to an emerging uptrend.
📍 Key Point: If the price holds above $10.40, this confirms a breakout from the descending channel, increasing the chance of reaching $10.75–$11.00.
📍 Price must also stay above $10.15 and not fall back into the previous range. A retest and bounce from this level would serve as further confirmation.
📢 If the price drops back below $10.15 and breaks $9.87, the “Inverted Head & Shoulders” pattern will be invalidated. In that case, a bearish trend will likely resume and a short toward $9.50–$9.00 could be considered.
📢 On the 4H chart, the risk of the bearish flag playing out still remains. We are monitoring the structure closely — a sharp pullback is possible.
📢 The volume zone around $10.15–$10.20 is key. As long as the price stays above it — the long scenario remains dominant.
🚀 As of now, BYBIT:TRUMPUSDT.P has strong technical reasons to support a long bias, especially if it holds above $10.40 — that would open the door to $10.75–$11.00.
Risks remain — particularly around the 4H bearish flag — but for now, bullish momentum prevails.
🚀 BYBIT:TRUMPUSDT.P still holds upside reversal potential — LONG scenario remains the priority!
TRUMPSOLUSDT.P trade ideas

TRUMP Ready for PUMP or what ?Do you think this will happen, or do you see TRUMP below $9.5 in the future?
Give me some energy !!
✨We spend hours finding potential opportunities and writing useful ideas, we would be happy if you support us.
Best regards CobraVanguard.💚
_ _ _ _ __ _ _ _ _ _ _ _ _ _ _ _ _ _ _ _ _ _ _ _ _ _ _ _ _ _ _ _
✅Thank you, and for more ideas, hit ❤️Like❤️ and 🌟Follow🌟!
⚠️Things can change...
The markets are always changing and even with all these signals, the market changes tend to be strong and fast!!

TRUMP - SMALL SCALP BUys worth it!So ideally this is the first time Ive seen such a good buy for TRUMP! Just wait for a dip. Not putting 10.85 as extreme targets but 11.13 looks good!

Official Trump price analysis$Trump coin will probably only go off when and if Trump wins the Nobel Peace Prize. And for this to happen, his activities and rhetoric must change completely... at the moment, it looks "on the verge of fantasy."
Meanwhile: A major investor lost money on TRUMP again - this time $3.3m, he sold 743,947 TRUMP for $7.92m, but did so at a loss.
The irony is that at the very beginning of trading this token, he earned $11.82 million. However, a series of unsuccessful trades resulted in serious losses - now his total loss on $TRUMP has reached $15.7 million.
1️⃣ If by some miracle OKX:TRUMPUSDT manages to break out above the trend price, then we can dream of $14.26 and $17.36
2️⃣ А if, again, he writes, or says, or does something stupid, which is more likely for this personality.... then #Trump at $7-7.2, why not.
Ten times less than the highs... that's where the success is!)

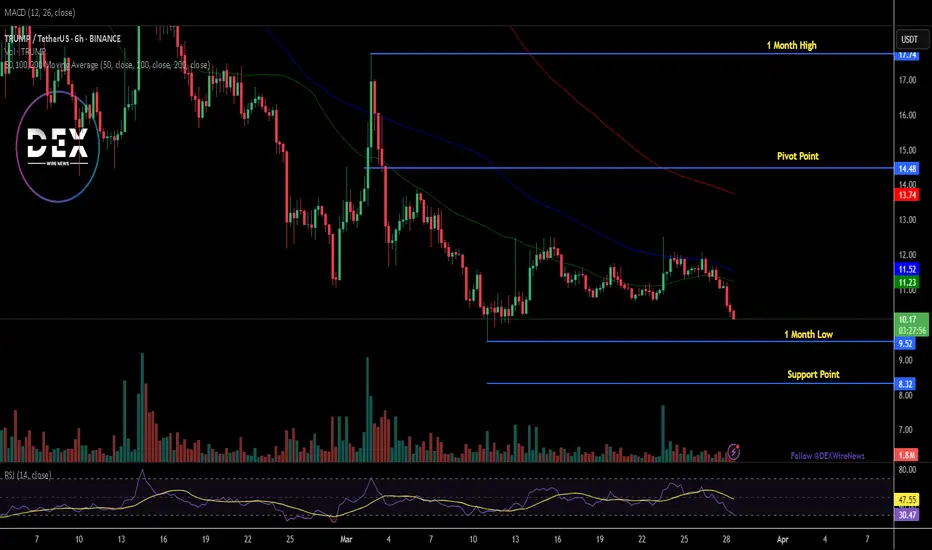
Breaking: $TRUMP Token Dips 10% Reverting to $10 ZoneThe price of OFFICIAL TRUMP coin ($TRUMP) tanked 10% today, falling back to the $10 region. The asset ever since peaking to an all time high of $76, faced insane selling pressure losing about 80% of total value together with its compatriot $MELANIA coin.
For Weeks now, $TRUMP has been circumventing in the $10- $12 zone albeit the crypto market was most of the time in a bloodbath season. For $TRUMP coin, should the bulls push the token above the 38.2% Fibonacci retracement point, that may be the catalyst the token needs to spark a bullish renaissance as hinted by the Relative Strength Index (RSI) at 30- pointing at the disparity $TRUMP has to capitalise and make a bullish move.
Similarly, the 1-month low is serving as support point for $TRUMP should extreme selling pressure push the token lower.
OFFICIAL TRUMP Price Live Data
The live OFFICIAL TRUMP price today is $10.21 USD with a 24-hour trading volume of $517,239,338 USD. OFFICIAL TRUMP is down 8.71% in the last 24 hours. The current CoinMarketCap ranking is #45, with a live market cap of $2,041,294,317 USD. It has a circulating supply of 199,999,430 TRUMP coins and a max. supply of 999,999,993 TRUMP coins.
Mastering Compulsiveness: Volatile Coins Like TRUMP Are a Trap My Take on Dealing with Compulsiveness in Trading: Lessons with TRUMPUSDT.P
Estimated Reading Time: Approximately 5 minutes
I chose to focus on TRUMPUSDT.P for this idea because its extreme volatility makes it a perfect example of how compulsive trading can spiral out of control. TRUMPUSDT.P, a perpetual futures contract tied to the TRUMP token, often swings 20-30% in a day, driven by political news and social media hype, which can easily tempt traders into impulsive decisions and overtrading.
After years of trading and studying trading psychology, I’ve learned how dangerous compulsiveness can be in the markets. I used to think being a good trader meant always being in the game, but I’ve seen how that mindset can lead to disaster. Compulsiveness is when you’re driven by the need to act—chasing the thrill of trading instead of focusing on steady profits. It’s a trap that can lead to overtrading, emotional exhaustion, and serious financial losses, not to mention the strain it puts on your life outside of trading.
From my experience, compulsiveness often unfolds in three stages. First, you get a taste of winning, and it makes you feel unstoppable, so you keep pushing for more action. Then, when losses start piling up, you enter a losing phase where you trade recklessly to get back what you lost. Before you know it, you’re in a desperation phase, completely consumed by the need to recover, which often leads to even bigger losses. I’ve been through this cycle myself, and it’s a tough one to break.
One thing that really helped me was learning how to spot compulsive behavior. I came across a set of questions from Gambler’s Anonymous that can help you figure out if you’re showing signs of compulsiveness—like feeling the urge to trade after a loss or letting trading take over other parts of your life. It’s a simple way to check in with yourself and see if you’re heading down a risky path.
Over time, I’ve picked up some strategies to keep compulsiveness in check and build better discipline. The biggest one is to only trade when I have a clear, logical reason—like a price reaching a key support or resistance level on the daily chart of TRUMPUSDT.P—otherwise, I stay out of the market, no matter how much I feel the itch to jump in. I’ve also learned to pay attention to my emotional state and recognize when I’m trading out of impulse rather than focus. Shifting my mindset to care more about the process of trading well, rather than the excitement of being in a trade, has made a huge difference. I make sure to take breaks when I feel the urge to overtrade, set strict limits on how much I’m willing to risk, and always take time to reflect on why I’m making a trade in the first place.
What I’ve come to understand is that trading isn’t about constant action—it’s about mastering your mind. Compulsiveness can ruin your trading if you let it take over, especially with a volatile ticker like TRUMPUSDT.P, but with self-awareness and discipline, you can get past it. For me, it’s all about trading with intention, keeping my emotions in check, and focusing on long-term consistency instead of short-term thrills.
If you found this helpful, keep following me for more educational materials on the psychology of trading. I’ll be sharing more insights and strategies to help you master your mindset and become a more disciplined trader.

TRUMP Want to Buy? | BTC | XRP | SUII really want to buy this meme coin because of significance it holds.
these are levels where it can bounce or where i am buying or adding or using stop below last 10.7 level
Right now holding 11.30 level and 100MA 4hr .
it may break resistance . keeping an eye on it and adding more bags

TRUMP/USDT:BUY LIMITHello friends
Given the price growth, now that the price is correcting, you can buy in steps and be careful to ensure that capital management is followed.
*Trade safely with us*

TRUMP in coming days ...Currently, TRUMP is forming an ascending triangle, indicating a potential price increase. It is anticipated that the price could rise, aligning with the projected price movement (AB=CD).
However, it is crucial to wait for the triangle to break before taking any action.
Give me some energy !!
✨We spend hours finding potential opportunities and writing useful ideas, we would be happy if you support us.
Best regards CobraVanguard.💚
_ _ _ _ __ _ _ _ _ _ _ _ _ _ _ _ _ _ _ _ _ _ _ _ _ _ _ _ _ _ _ _
✅Thank you, and for more ideas, hit ❤️Like❤️ and 🌟Follow🌟!
⚠️Things can change...
The markets are always changing and even with all these signals, the market changes tend to be strong and fast!!

TRUMP(UPDATE)Hello friends
Given the good price growth, now in the pullbacks that the price makes, we can buy in the specified support areas and move with it to the specified targets.
Of course, with capital and risk management...
*Trade safely with us*

One Trump Coin - same as a one gold barThere will never be anyone in the world who will promote their coin better.
Tromp coin will explode.

Trump can break the downtrend and start a reversal Hello Cryptosuppliers,
Trump third leg down already. Last couple of weeks where in a downtrend but price is holding now. We can see some reversal.

TRUMPUSDT soon breakout to the upside and heavy pump aheadAs we can see Trump is near major daily support zones and it can rise soon now or after more -50% dump and from the major support of 5$ it can pump like the green arrows mentioned on the chart.
DISCLAIMER: ((trade based on your own decision))
<<press like👍 if you enjoy💚

$TRUMP 4HTF🚀 $TRUMP 4H Analysis
📊 4H Timeframe Update:
🔺 Symmetrical Triangle Formation – Price is consolidating within a tight range, nearing the apex, where a breakout is likely.
⚡ Breakout Scenarios:
🟢 Bullish Case: A breakout above $11.40 - $11.60 with strong volume could trigger a rally.
🔴 Bearish Case: Losing $10.70 - $10.60 may lead to a deeper pullback.
🔍 Key Levels to Watch:
✅ Break & Retest Above $11.60 → Possible bullish continuation.
⚠️ Break Below $10.60 → Bearish confirmation.
🚨 Patience is key! Wait for confirmation before entering a trade.

TRUP/USDT in the coming hoursHello everyone, let's look at the 4H TRUMP to USDT chart, in this situation we can see how it has come out of the triangle on top and currently we can see a fight with the current resistance at $11.45, in a situation when it comes out of it on top it can go towards the targets at the levels:
T1 = $11.89
T2 = $12.58
Т3 = $13.08
Now let's move on to the stop-loss in case the market continues to fall:
SL1 = $11.06
SL2 = $10.40
SL3 = $9.76
When we look at the RSI indicator we can see how on the 4h interval we have come out of the range on top, which however in the short term may give an attempt to recover the price or a temporary sideways trend.

TRUMPUSDT - Is this your worst investment?I guess so because this was so hyped and its so hyped it fell down to the brim, Falling to the brim and what amazes me is the volume spike is not permanant!

Trump Coin $5, so so similar to bonkuuuummmm yea, i think my chart speaks for itself, I keep coming back to this freaking coin!
Ive never had this level of confidence in an idea relative to its potential gain.

TRUMP MEME COIN TO $77 – LAMBO SEASON IS WILL BE HERE!I just did what any rational investor would do… SOLD MY CAR TO GO ALL-IN ON TRUMP COIN! 🚗➡️🚀 Because who needs wheels when you’re aiming for a Lamborghini by year-end?
Currently sitting at $10, this absolute rocket ship is gearing up for a 777% move to $77—a number so patriotic it might just get its own national holiday. Elliott Wave 2.0, Fibonacci magic, and pure meme momentum all align for a face-melting rally!
🔥 Catalysts fueling the moon mission:
✅ 2024 election hype = infinite liquidity
✅ Meme magic = unstoppable retail FOMO to kick in
✅ "Only up" is my new trading strategy
By the end of the year, we’re either driving Lambos or explaining to Uber drivers how we were “early”. ALL IN, BABY! 🚀🇺🇸

TRUMP buy/long setup (4H)It seems that a diametric has completed on the chart. However, Wave G is suspected not to have fully ended yet, and only a part of Wave G might be complete.
A trigger line has been broken, and a support zone has formed, where short-term trades or scalping opportunities can be considered.
As you know, this is a meme coin and carries risk, so make sure to manage leverage and capital properly.
Targets are marked on the chart—secure profits at each target.
The closure of a 4-hour candle below the invalidation level will invalidate this analysis.
For risk management, please don't forget stop loss and capital management
Comment if you have any questions
Thank You

Will Trump’s crypto lose 26% more after breaking key levels?Hello and greetings to all the crypto enthusiasts, ✌
All previous targets were nailed ✅! Now, let’s dive into a full analysis of the upcoming price potential for Trump 🔍📈.
Trump’s cryptocurrency has undergone a sharp decline, losing all Fibonacci support levels and previously established temporary support zones. I had foreseen this downturn from higher price levels, and current market conditions suggest the potential for at least another 26% drop. A break below the critical psychological support at $10 could accelerate further losses, with my primary downside target set at $9. This scenario aligns with my broader technical analysis, indicating continued bearish momentum in the asset.📚🙌
🧨 Our team's main opinion is: 🧨
Trump’s cryptocurrency is crashing hard, breaking all key supports, and if it falls below $10, I expect at least another 26% drop, with $9 as my main target. 📚🎇
Give me some energy !!
✨We invest hours crafting valuable ideas, and your support means everything—feel free to ask questions in the comments! 😊💬
Cheers, Mad Whale. 🐋

TrumpHello Traders,
Today we are posting a trade we see that we know you are all eyeing. BINANCE:TRUMPUSDT
This is a trade we saw in our weekly trade hunt. If you are not familiar in TA and have a hard time understanding the chart feel free to reach out to us and we will happily help you understand.
Stay profitable,
Savvy

TRUMPUSDT LongConsolidation between 11 - 14,5 levels on Trump H4 chart, Now price is at support zone. We can buy at catch this small uptrend. Risk reward 1/2

$TRUMP ─ @realDonaldTrump Long Trade SETUP$TRUMP ─ @realDonaldTrump Long Trade SETUP 👀
Looking for another long trade entry.
⚠️If the Twin OB fails, then a new low is on the table.
ENTRY = TwinOB + FibFan + nPOC + Fib Golden Pocket + WO + DO
SL = below VAL + TwinOB
------------
------------
As always, my play is:
✅ 50% out at TP1
✅ Move SL to entry
✅ Pre-set the rest of the position across remaining TPs
It's important to take profits along the way and not turn a winning trade into a losing trade.
