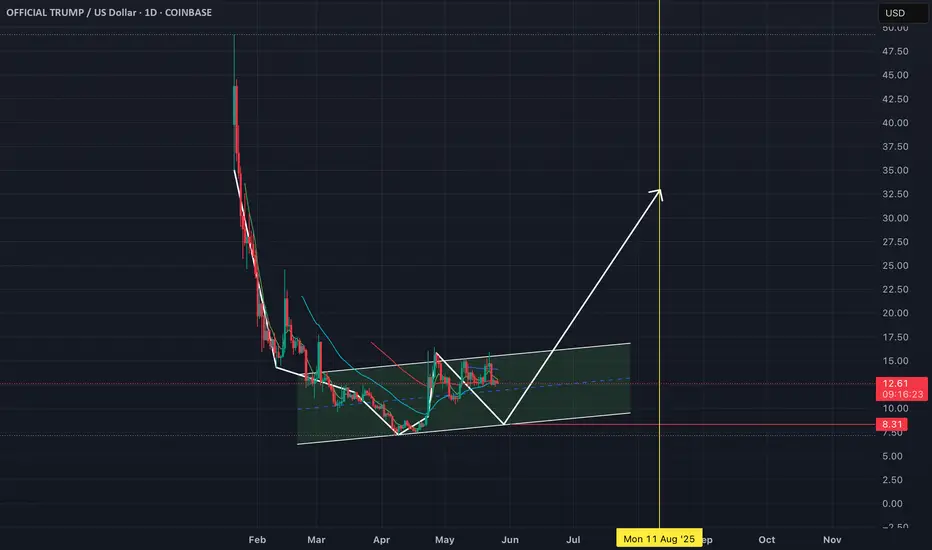
TrumpCoin will be tremendous!Cup and handle almost complete for the next jump.
This is in wave 3 of elliot wave and likely the largest wave. I expect this to be around $35-45 around the end of the year.
TRUMPUSD trade ideas

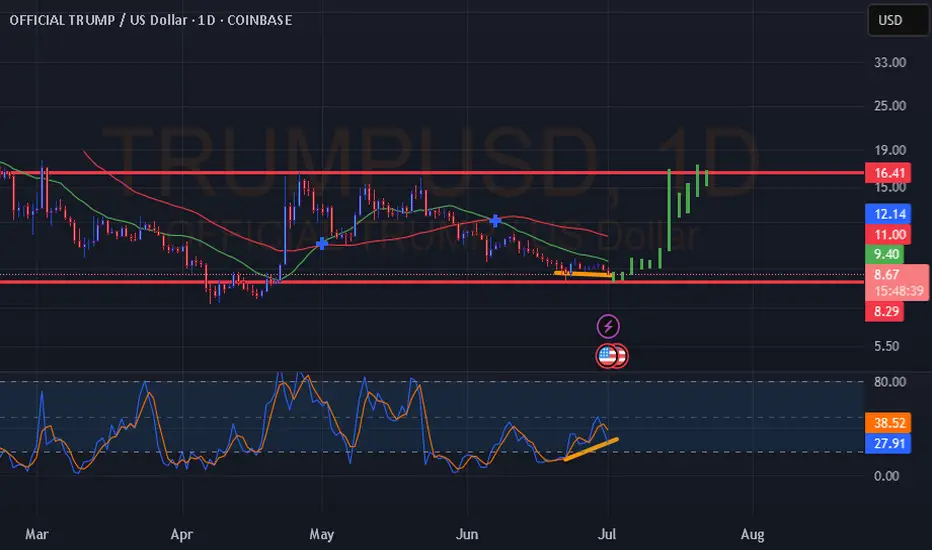
Trump closed green on line break chart daily
It's not often we see Trump close green on the line break chart but today's daily finally did. Trump has also yet to make a higher high on the daily and I believe once it does we'll see a big pump to the target I have placed.
Trump's ATR is currently 0.46 with a volatility of 6.13% possible movement in a day. Assuming things go south, I don't recommend holding more than 20% of your portfolio as Trump due to the volatility. This will help keep your portfolio safe via risk management should the line break green candle not result in a pump. That said I am quite bullish on Trump, let's see how this goes.

TRUMP USD Bullish DivergenceHi Everyone. TRUMP showing some strength here. Could be an overall price reversal starting off as indicated. Not financial advice. Good luck.
#TRUMP/UDT#TRUMP
The price is moving within a descending channel on the 1-hour frame, adhering well to it, and is heading towards a strong breakout and retest.
We are experiencing a rebound from the lower boundary of the descending channel, which is support at 11.10.
We are experiencing a downtrend on the RSI indicator that is about to break and retest, supporting the upward trend.
We are heading towards stability above the 100 Moving Average.
Entry price: 11.22
First target: 11.37
Second target: 11.55
Third target: 11.77

TRUMPUSD Bearish BreakdownWatching $7.30 for Rebuy Zone After Support Fails
TRUMPUSD just broke key EMAs and is testing long-term support. Watching for buy zones near $9–7.30. Targeting a bounce toward 13.50–17.20 on recovery.
Volume is increasing on red days, RSI shows bearish momentum at 38, and a bearish divergence has triggered. The 23.6% Fib level at $17.22 has now become a strong resistance barrier.
Support is breaking. Don’t try to be a hero mid-fall. Let price come to you. The real value lies near $7.30–9.00, and the best profits will come on the reversal. Trim into strength, not into weakness.
*REMEMBER, everything is probability, nothing is investment advice. Educational only!

TRUMP/USD – Watching Key Support at 12.45–12.15 for Potential ReThe TRUMP/USD pair is consolidating near the strong horizontal support zone at 12.45–12.15, aligning with the 61.8% Fibonacci retracement of the previous bullish leg.
🔹 Key Levels & Scenario:
Support zone: 12.45–12.15 – price has repeatedly tested and held this area
Upside targets:
50% retracement at 14.096
78.6% retracement at 15.134
The pair is showing early signs of stabilization, suggesting a potential rebound toward these Fibonacci levels if the support holds.
📉 Invalidation:
A decisive daily close below 12.15 would invalidate the bullish bias and open the door for deeper retracement.
📌 Trading Plan:
Watching for price action signals (candlestick reversal or breakout) above 12.45
Targets: 14.096 and 15.134
SL: Below 12.15 for a conservative risk management approach
This idea focuses on the potential for a short-term reversal in a larger consolidation phase, supported by clear Fibonacci and horizontal confluence.

Trump coin forms an ascending triangle patternTrump Coin failed to hold its bullish breakout after unexpected EU tariff news. The setup had a well-defined stop, limiting losses as price reversed. A new ascending triangle may be forming, offering potential for future upside if resistance breaks.
This content is not directed to residents of the EU or UK. Any opinions, news, research, analyses, prices or other information contained on this website is provided as general market commentary and does not constitute investment advice. ThinkMarkets will not accept liability for any loss or damage including, without limitation, to any loss of profit which may arise directly or indirectly from use of or reliance on such information.

Trump usdtJiggle physics test and it is not that it is it was the first thing that is it is it will take to cook in a few weeks ago for youand I will send that it is not that good for youand it was
TRUMP/USD is holding firm at a major confluence zone.TRUMP/USD is holding firm at a major confluence zone; the bottom of a month-long consolidation box and a clean uptrend line that’s been respected since early May.
Price is compressing just above the $12.30–$12.50 support zone, setting the stage for a potential breakout attempt if demand holds. Volatility has dried up, signaling accumulation.
Technical Breakdown:
Support: ~$12.30 horizontal + rising trendline
Resistance 1: ~$13.50 (mid-range reaction zone)
Resistance 2: ~$14.80–$15.00 (top of the range)
Breakout Target: $16.40 (April high), $18.80 (fib extension)
Strategy:
Buy Zone: $12.30–$12.60 (trendline support)
Add-on: Break and hold above $15.00
Stop: Close below $12.00 or trendline violation
Invalidation: Breakdown with volume under $12.00
Let price confirm strength above $13.50 and volume surge above $15 — don’t chase, trade the structure, not the emotion.
*REMEMBER, everything is probability, nothing is investment advice. Educational only!

Is Trump Coin ready to double?Trump Coin ranks 36 among meme coins but might climb fast if Bitcoin surges. Watch this breakdown for entry points and what it would take for \$44 to become a reality.
This content is not directed to residents of the EU or UK. Any opinions, news, research, analyses, prices or other information contained on this website is provided as general market commentary and does not constitute investment advice. ThinkMarkets will not accept liability for any loss or damage including, without limitation, to any loss of profit which may arise directly or indirectly from use of or reliance on such information.

TrumpUSD 1H bearish DivergenceTrump USD is looking bearish on a 1H timeframe. Clear bearish divergence. Looks bad once it breaches the Low and forms a LL structure.

Where is TrumpUSD headed? ...... a new LOW? or UP?I am not an expert trader by any means, I am open input and sharing my ideas. I am still learning.
----------------------------------------------------------------
Price is noted between a support and a resistance
Two patterns were noted here.
1 Double Top formation
2 Parallel channel
----------------------------------------------------------------
SELL
Factors:
Most indicators are neutral for this pair. Some in smaller timeframes, suggesting a short sell. This could be the sell we need to return to support to see if a successful breakout is possible.
Target suggestion: the measure of double top
----------------------------------------------------------------
BUY
Factors:
the channel is a bullish channel, so price is likely to hit above it and hit it.
Target suggestion: the measure of channel

TRUMP is always the LEADER !!!!!!Hello all,
Again and again, Mr. President Donald TRUMP is the leader.
He is clever enough.
Enjoy
MIZ

A bet on US geopolitical power I lomged trump some time ago. I won't say at what price but i think this will pump a bit today as the dinner snapshot approaches. Some normie influenzas are convincing their followers to short it into the snapshot but i think except for some minor corrections there will be no major crash to $8 or whatever. This token is slowly and steadily going to creep back up to $100 price. whenever trump solves global conflicts such as india-pakistan, ukraine- israel etc. It'll positively influence the price of this token. A bet on $trump is a bet on $trump's presidency. Whether he will prove to be a good president or not is upto you. Regardless, keks will be had.

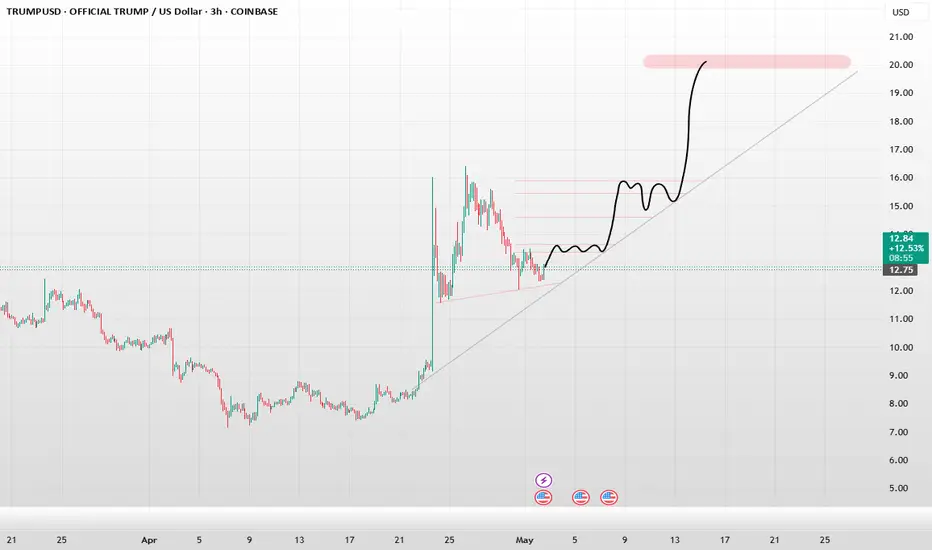
TRUMP to $20? With Leverage 5x–10x, Why NotTrump Coin Holding Strong — For Better or Worse 😅
TRUMP has shown solid support around $12 and — unfortunately — it's currently one of the highest-volume coins in the market.
To reach $20, it needs to break through the $13–$13.5 resistance.
Given Bitcoin's strong bounce today, that might happen easily.
If it does, I expect a fast move toward $20.
Entry: ~$12
Stop Loss: $11.85
Targets:
TP1: $13.40
TP2: $14.73
TP3: $19.37
⚠️ Due to the nature of this coin, a sharp crash is very likely after hitting targets — I highly recommend taking profit.
📢 And remember: keep an eye on news or sudden moves by President Trump himself. You never know.
$trump coin kingmakerpeople who went to the top schools for business are competing with a mf like me who wakes up and is baked by 11am (post gym session of course)

I Love Trading Pairs Trump/MelaniaEvery time Trump has been strong to Melania we find a top in overall price. The 4H RSI shows we are about to fall as well.

Trump broke the down trendTake a look in the chart
Trump coin broke the down trend and set up to go up trend
Expecting a huge movement
First target 15
Second target 24
Last target new all time high if we managed to break the 24$ resistance

Just In: $TRUMP Dips 5% Down to $10.86 Pivot Trump token a coin created in the start of the year 2025 that saw a noteworthy uptick surging from a low of $3 to almost $80 dips 5% today retracing to the $10.888 support point amidst general crypto landscape.
The 78.6% Fibonacci retracement point is acting as support point for $TRUMP a break below that level could lead to the 1-month low axis as the RSI is weak presently at 37.
Similarly, a break above the 38.2% Fibonacci retracement point could spark a bullish reversal move or a temporary reprieve albeit the crypto market is volatile at the moment.
OFFICIAL TRUMP Price Live Data
The live OFFICIAL TRUMP price today is $10.84 USD with a 24-hour trading volume of $476,149,181 USD. OFFICIAL TRUMP is down 5.55% in the last 24 hours, with a live market cap of $2,167,125,027 USD. It has a circulating supply of 199,999,527 TRUMP coins and a max. supply of 999,999,993 TRUMP coins.

trump meme s crypto time to rocketfalling wedge finished .. 5 correctives wave s completted .. time to break out and push up so hard

TRUMP COIN BULLISHDonald Trump's presidency was marked by his strong influence on political and economic policies, as well as his ability to galvanize a dedicated base of supporters, which has created a lasting cultural and financial brand. This brand loyalty and his continued prominence in public discourse could drive demand for Trump Coin, as supporters and investors view it as a symbolic asset tied to his legacy, potentially increasing its value over time.
-R

TRUMP- Believe it or notRipley or Bentley's--- This is the move of 2025. Just wait until Trump mentions it online or on TH- What if this coin becomes the tender to surpass the tariffs. I not only can move money but influence the market through it's historic patterns. See Head and shoulder.

TRUMP 2-21🔥 Market Overview:
Trend: TRUMP/USD is in a downtrend, consolidating below the 200 EMA, with limited bullish momentum.
Key Levels:
Resistance: $17.05 – The 200 EMA acting as a strong resistance.
Support: $16.60 – Holding price from further decline.
Indicators:
EMA 200: Price remains below, confirming bearish dominance.
MACD: Bearish, with slight divergence indicating possible consolidation.
RSI: 46.70 – Neutral, but leaning toward oversold territory.
🔥 Scalping Strategy (Expanded Targets)
🩸 1. Range Scalping
Buy near: $16.60 – $16.65, targeting $16.90 – $17.05.
Sell near: $17.05 – $17.15, targeting $16.60.
Stop-loss below: $16.50.
Profit Potential: ~2.71% per trade.
🩸 2. EMA Scalping
Long entries near: $16.60 with stop-loss at $16.50.
Exit at: $17.05 resistance.
🩸 3. Breakout Scalping
If TRUMP/USD breaks above $17.05, go long toward $17.50 – $18.00.
If TRUMP/USD drops below $16.50, short toward $16.00.
🔥 Mid-Term Trend Forecast (1-3 Weeks):
If TRUMP/USD holds above $16.60, expect a retest of $17.05+.
A break below $16.50 opens the door for further decline to $16.00 or lower.
🔥 News & Market Context:
TRUMP/USD is down -61.86% in the last month, indicating a lack of sustained demand.
No strong bullish catalysts present at the moment.
Low trading volume suggests whales are not accumulating aggressively.
🔥 Decision:
🩸 Short-term: Favor range scalping between $16.60 – $17.05.
🩸 Mid-term: A breakout above $17.05 would signal a potential reversal.
🩸 Ideal Play: Buy near $16.60, sell near $17.05, or short below $16.50.
👑 Final Verdict:
TRUMP/USD remains weak below $17.05. Until bulls reclaim this level, range scalping is the best strategy. If it breaks below $16.50, further downside is likely.
🔥 "In the battlefield of trading, hesitation is a weakness. Move with precision, or be swept away." 👑
