Trump's signalHello friends🙌
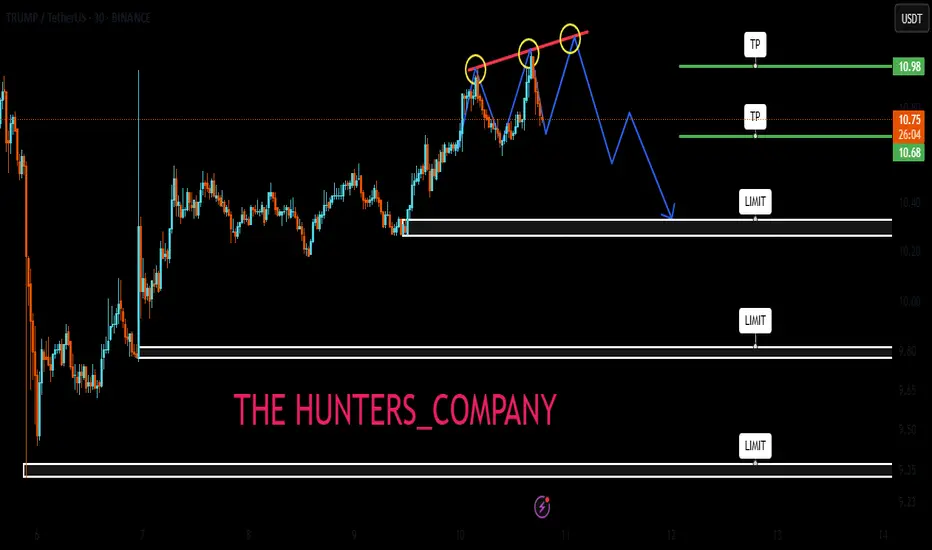
🔊Given the good growth we had, you can see that the price has hit resistance and you can see that the upward waves are getting weaker, which indicates that we are likely to have a correction until the support areas are identified...
You can buy in the identified support areas in steps and with capital management and move with it to the specified targets.
🔥Join us for more signals🔥
*Trade safely with us*
TRUMPUSDT trade ideas
TRUMP to $100? Code 144 and Trump's Birthday I want to share my unique hypothesis, which no one has discussed before. I noticed an interesting pattern: on the 144th day after listing, a pump began for meme tokens like SHIB, PEPE, DOGE, FLOKI, and BABYDOGE.
I call this "Code 144" — and I believe the same scenario could repeat with the TRUMP token, especially considering June 14th is Donald Trump's birthday. This is the perfect media opportunity to trigger a FOMO wave, especially if it coincides with this critical 144th day.
📌 What’s important:
The same pump pattern on these coins' charts (possibly controlled by the same market maker);
TRUMP is currently in an accumulation phase;
The US election hype could amplify the effect;
I expect a pump near June 14th, as part of the "Code 144."
The target for TRUMP, based on this scenario, is $100 as a short-term spike due to the hype.
⛔ This is not financial advice, but my personal idea based on observing past cycles of meme tokens. I’m sharing it to document the hypothesis and check it against time.

TRUMPUSDT price analysis✊ It seems that the price of $Trump will only skyrocket when #Trump is impeached!
And we're keeping our fingers crossed that this happens as soon as possible... Mr. #Musk, you have nothing to lose — spill the beans!
As a Ukrainian classic wrote: “I gave birth to you — I will kill you.”
🕯 As for the price of OKX:TRUMPUSDT , it is moving very harmoniously and according to the canons of TA, regardless of who makes some “news throws” and does it on time or not.
And this is not surprising, as the crypto market titan Justin Sun has invested in it. His reputation is controversial, but he knows how to defend his “creations” and investments, pump them up, and make money on them.
So, it's purely hypothetical to assume that the price of $Trump will continue to rise, but this is by no means a call to invest in the red-haired jerk's coin. ✊
_____________________
Did you like our analysis? Leave a comment, like, and follow to get more

Potential BuyTrump coin has a visible IH&S, with the right shoulder slowly forming.
The buy would be good at the current point with the stop loss slitely below the left shoulders candle.
TRUMPUSDT In my opinion, we could still see a further 10% drop, considering the market’s cyclical nature — though it does feel like we’re near the bottom at this point.
Based on the indicators below, MACD and CCI are also showing signs of compression, similar to what we're seeing in the technical analysis.
Overall, I think by June 20th we’ll have a clearer picture of where the breakout from these triangle formations is headed

Trumpcoin long Just recently opened a long position on Trump. Targeting $11.4-$11.889 area
Time sensitive.
For context as well- Cpi news just came out with cpi readings 2.4% which is below expectation of 2.5%
Going based on the price action and my edge separate from news the market looks like it wants to pump

Trumpcoin longI think the market will attempt to break daily structure bullish on Trumpcoin today. Took a long trade on it.
Tp 11.367
Time sensitive. Might correct but likely won't by much I reckon.

Live Trump TradeHello friends
Based on the analysis and research we have concluded that it is possible to enter into a transaction with risk and capital management, given the entry of buyers and the price pullback.
*Trade safely with us*

Trump coin long back to $10.7 Today#trumpcoin conservative long...maybe experience a bit of drawdown
🎯Tp: $10.7
🛑Stop: $10.17
💰Roughly 2.35RR
#Trump


Trump Crypto Setting the Stage for a Massive Move?The Trump-themed crypto ($TRUMP or related memecoins) might be preparing for a 100% gain based on recent momentum, political buzz, and chart patterns.
With rising volume, bullish structure, and a wave of retail interest this could be the perfect storm.
📈 Key zones to watch:
Support: 10.421
Resistance: 13.288
Bullish target: 23.640
Stay alert. Always manage risk. This could get wild.
💬 What’s your take? Moon or mirage?

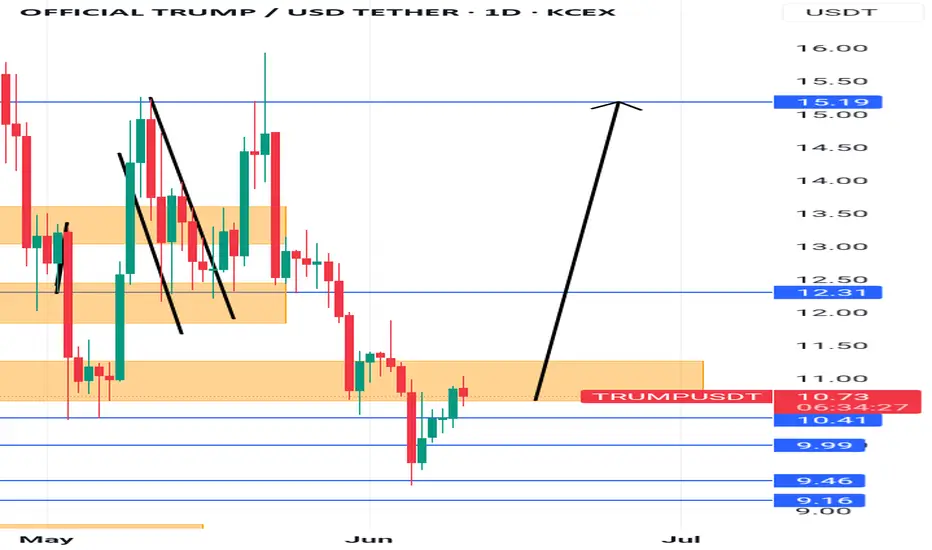
TRUMPUSDT – Daily Technical AnalysisTRUMPUSDT – Daily Technical Analysis
The price has reached a key daily support level at $10, showing potential signs of a bullish reversal.
If the support holds, we may see a move toward the resistance area around $14, offering a decent upside opportunity.
In a more bearish scenario, the price could extend its correction to the $9 support zone, which may serve as a stronger foundation for the next upward impulse.
🟢 Key Support Levels: $10 (daily), $9 (secondary support)
🔴 Resistance Zone: $14
Stay tuned for more technical insights and updates.

#TRUMP/USDT#TRUMP
The price is moving within a descending channel on the 1-hour frame and is expected to break and continue upward.
We have a trend to stabilize above the 100 moving average once again.
We have a downtrend on the RSI indicator that supports the upward move with a breakout.
We have a support area at the lower boundary of the channel at 9.53, acting as strong support from which the price can rebound.
Entry price: 9.70
First target: 10.07
Second target: 10.40
Third target: 10.70

TRUMP Update on a Daily Timeframe.TRUMP is currently forming a symmetrical triangle pattern and is holding above the support trendline at $11. For a bullish confirmation, it needs to break above the blue box zone, which ranges between $12.5 and $15.5.
On the downside, if TRUMP breaks below the support trendline, the next key support lies at $7.3 — and it must hold strong.
Let’s see how this plays out. For now, I’ll be keeping a close eye on it and will update you with the next move.
Until then, trade safely.
Regards,
Dexter

$TRUMP Bounces from Golden Pocket – Rally Incoming?$TRUMP has bounced from a strong support zone around $10.30–$10.50, which lines up with the 0.618 Fib level.
As long as this support holds, price could push toward $11.78 and possibly higher to $13.00+ if momentum builds.
The structure looks healthy, and buyers are stepping in again.
Keep watching, a move toward the upper levels may be starting! 👀
#Trump #ALTSEASON

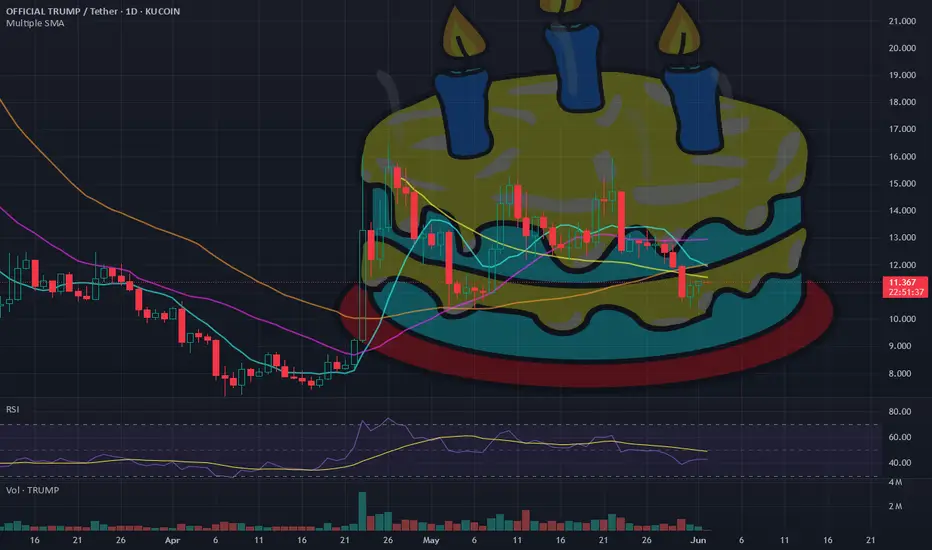
cake patternTrump coin is forming rare cake pattern with completion on June 14, Trump's birthday. Price target can be somewhere at $16.
TRUMP - UPDATESo now we are facing the second option worked. Fine, I`ll be looking for LONG now from this level. NFA - DYOR

Trump Coin Wave Analysis – 30 May 2025
- Trump Coin broke the support zone
- Likely to fall to support level 10.00
Trump Coin recently broke the support zone between the support level 11.95 (which has been reversing the price from the start of May) and the 50% Fibonacci correction of the upward correction (2) from the start of April.
The breakout of this support zone continues the active impulse wave 3 of the intermediate impulse wave (3) from April.
Trump Coin can be expected to fall to the next round support level 10.00 (which stopped the previous wave 1 at the start of May).


TRUMP to 15$ then 17.5$Three signals are in one hour Timeframe
1- ThreeMoving Averages cross
2- MACD divergence
3 - Stochastic buy signal
Target is 15$ then 17.5$
