I believe this chart has bottomed, Alt szn is around the corner Recent PA had retested some great liquidity. I believe in a mini alt szn happening this week. So i believe the RR is worth it. Been a sleeping giant for a bit
TRUMPUSDT trade ideas

OFFICIAL TRUMP 1,244% Target Revealed & Map UpdateI have several questions for you:
1) Did the market break your patience? Are you still holding?
2) How much are you going to take? Will you go for 278% or maybe 1,244%?
TRUMPUSDT has been really uneventful lately and this is good, it means that consolidation is still happening and consolidation is a form of exercise for a trading pair; TRUMPUSDT is building strength.
From a technical analysis perspective, the chart is great, still bullish continues bullish; looks good. Because the action continues to happen as a higher low compared to 7-April. 7-April is the market bottom, as long as this level is not challenged or broken we are now in the bullish zone.
The move that peaked in late April is the initial bullish breakout. The higher low 22-June marks the point where the retrace from the initial bullish breakout ends. 22-June can also signal the start of the next upthrust. From here on we will see growth.
Higher lows lead to higher highs. We have a very clear, strong and ecologically sustainable higher low. This means that a higher high comes next.
Here is the tricky, not so tricky part: TRUMPUSDT will grow to $50, $62, beyond $100 and so on, but, not all growth happens in a single wave. Just as TRUMPUSDT moved from $7 to $16 and then stopped, it can move from $9 to $34 and then make another stop, this one short. Then another rise toward $50 and so on. The market never moves straight down but neither straight up. And this gets us to my point. Will you sell when resistance is hit to later buy back lower, or, will you continue waiting until the market top, higher targets?
That's the question you need to answer to maximize profits when the action goes green. If you decide you want to sell the wave, then make sure to prepare to sell when the market is green. What happens is that if you don't sell when green but wanted to take some profits then you will do so when the market is red. In this case you will not be taking out the maximum possible...
Anyway, we have to leave something for another day. TRUMPUSDT will grow, for certain, but it takes time. Patience is key.
Thank you for reading.
Namaste.

Middle East War Whispers: Is Bitcoin About to Crash?The scent of conflict is once again in the air over the Middle East. Tensions are rising, and traders are starting to worry.
If war erupts once more in the region, will Bitcoin and the crypto market survive? Or should we prepare for a heavy drop?
In this analysis, we’ll explore realistic scenarios and tools that experienced traders use to protect themselves in moments like these.
Hello✌
Spend 3 minutes ⏰ reading this educational material.
🎯 Analytical Insight on Official Trump:
Official Trump continues to exhibit high sensitivity to political narratives and has recently entered a multi-leg correction phase amid escalating Middle East tensions 🌍. Based on current price structure and sentiment flow, a potential drawdown of approximately 30% appears likely, with a key downside target projected near the $6 region 📉.
Now , let's dive into the educational section,
📌 How Markets Have Reacted to Geopolitical Tension
Historically, during major geopolitical flare-ups, risk markets like crypto have shown heightened sensitivity. What matters most isn’t the exact nature of the conflict — it’s how the market interprets the situation. Price doesn’t move on truth; it moves on perception.
🔍 TradingView Tools to Navigate Crisis and Spot Potential Sell-Offs 📊
When fear dominates the market and uncertainty clouds every candle, TradingView’s built-in tools become essential for staying ahead. Let’s explore the most practical ones for moments like this:
Market Sentiment Indicators
Tools like the Crypto Fear & Greed Index combined with higher time-frame volume analysis can help you track the mood swings that drive market volatility.
Layered Watchlists
Create watchlists that compare major projects with volatile meme coins or micro-caps. Early exits often show up as disproportionate drops in smaller assets before the big ones move.
Smart Alerts Based on Price Behavior
Set up alerts not just for price levels, but for candle closes, trendline breaks, and sudden volume shifts. These help you act swiftly, without letting fear control you.
Cross-Market Correlation Tracking
Use TradingView’s Compare function to monitor Bitcoin’s correlation with assets like gold, oil, or the dollar index. Shifts in capital flow toward safe havens may signal a crypto downturn.
Heatmaps for Crowd Behavior
Heatmaps let you see real-time buying and selling intensity. During panic phases, expanding red zones on the map could indicate larger market fear and potential liquidation zones.
🎯 What Should You Do? Scenarios and Strategic Responses
When the headlines are hot but the charts unclear, neither blind holding nor panic selling helps. Let’s break down potential paths:
Scenario One: Sudden and Escalating Conflict
A quick escalation may trigger immediate sell pressure. Watch for key levels and volume patterns to protect or hedge open positions.
Scenario Two: Prolonged News-Driven Tension
This usually creates choppy, range-bound price action. Combining momentum indicators like RSI with moving averages can help filter out fake-outs.
Scenario Three: The Dangerous Silence
A flat, quiet market can hide a ticking bomb. Underlying sell pressure might build unnoticed. Combining macro news with multi-timeframe analysis is key here.
🧠 Psychology of Fear in Unstable Times
In unstable markets, emotion drives action. When fear spreads faster than facts, many traders get caught off guard. Relying solely on what your eyes see in price action can mislead you. Instead, look at alerts, volume shifts, sentiment data, and crowd reactions.
⛑️ Final Tip for Traders
During crisis rumors and uncertainty, the worst decisions often come from rushing or overreacting. If you don’t have a clear plan, stay out. Use the tools available, prepare for multiple outcomes, and remember — your capital is your power. Don’t gamble it on noise.
🧾 Final Thoughts
The market stands at a psychological and strategic crossroad. With Middle East tensions rising again, crypto traders must prepare, not panic. Use the depth of TradingView tools, plan for different outcomes, and react with logic — not fear.
In times of crisis, survival comes before profit.
✨ Need a little love!
We put so much love and time into bringing you useful content & your support truly keeps us going. don’t be shy—drop a comment below. We’d love to hear from you! 💛
Big thanks, Mad Whale 🐋
📜Please remember to do your own research before making any investment decisions. Also, don’t forget to check the disclaimer at the bottom of each post for more details.

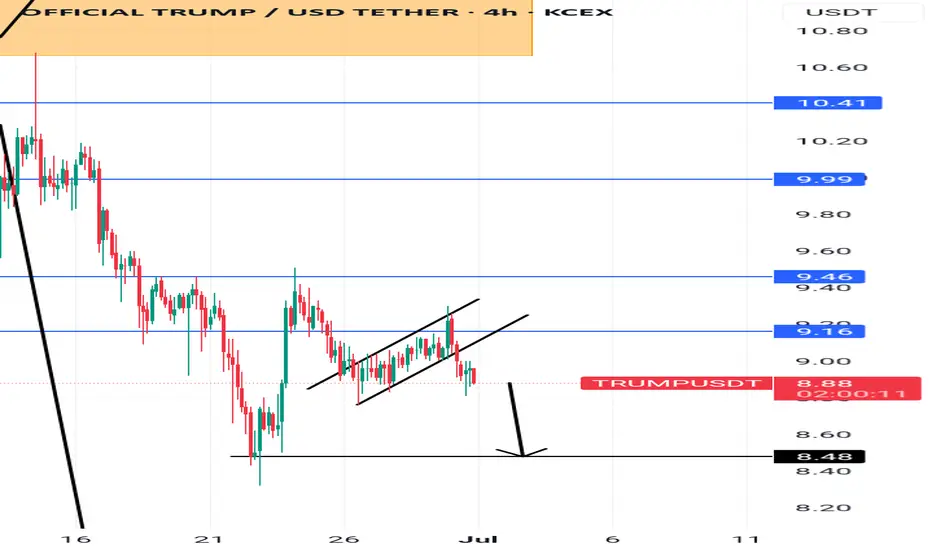
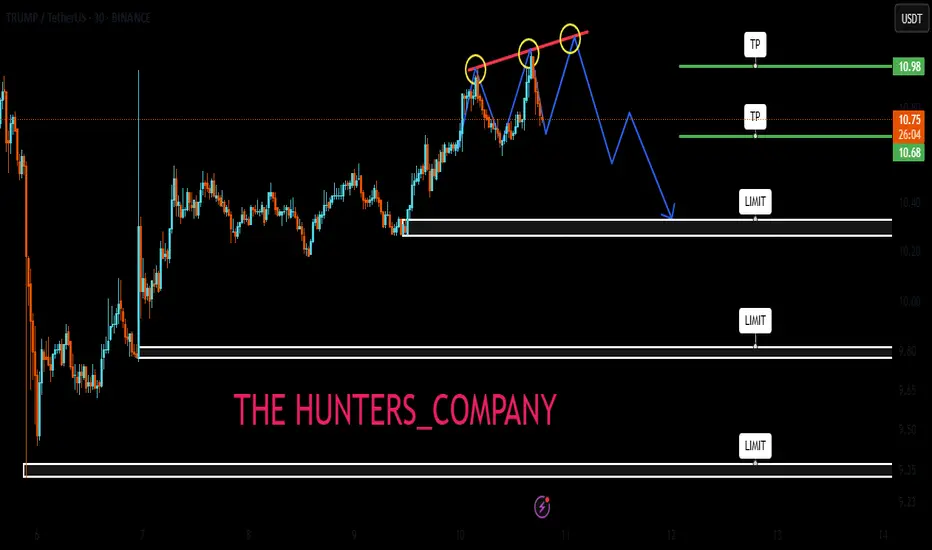
Continuous Sell opportunity There is an M formation , followed by a bearish continuous pattern to finish the m structure
Trump:New update(don't miss it)hello friends👋
This time we came with the analysis of Trump's famous coin meme, which you requested a lot.
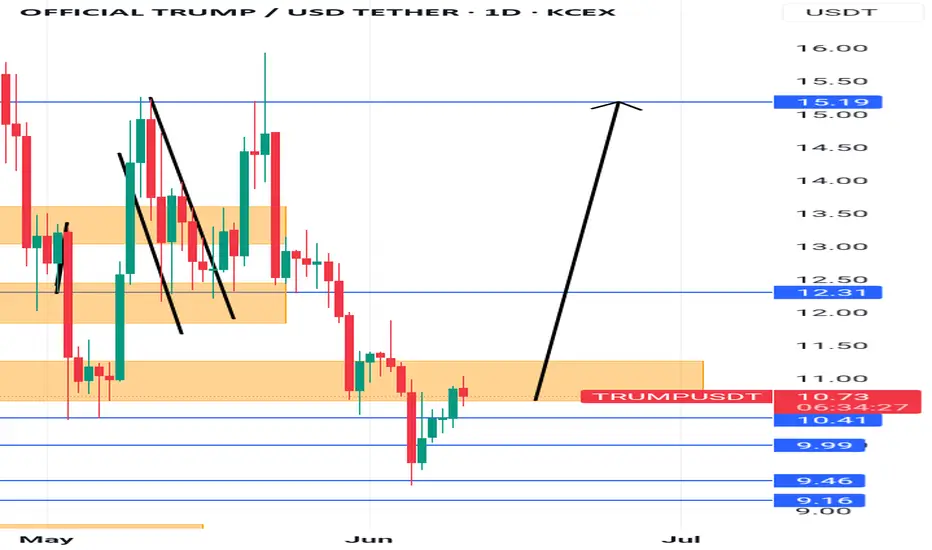
Well, as you can see, by making a double floor, the price has broken its downward channel and has grown well.
After the price growth, we saw the price suffering and then the price correction, which caused the formation of an upward pattern.
Now, according to the successful formation of this ascending pattern, it should be seen whether the buyers support the price in the specified support areas or not...
Pay attention that our trend is upward and the pattern made also shows an upward trend, that's why we have identified the support areas for you to enter the transaction step by step with risk and capital management.
🔥Follow us for more signals🔥
*Trade safely with us*

Trump Coin Bullish Setup!Trump Coin is showing some promising signs, currently around $8.50. I see potential for it to reach $20. As always, make sure to use stop-loss orders and manage your risk carefully.

TRUMPUSDT Symmetrical triangle breakout bullish from support📈 BINANCE:TRUMPUSDT – Symmetrical Triangle Breakout Alert! 🟢
1H Time Frame Analysis
Trumpusdt has broken out of a symmetrical triangle pattern from the key support zone at $8.90 — a bullish move is now in play! 🚀
🎯 Technical Targets:
Target 1: $9.20 – Key supply zone
Target 2: $9.50 – Bearish order block (watch for possible rejection here)
📊 Momentum is building — keep an eye on volume confirmation and retests!
This could be a solid opportunity for intraday traders or swing setups.
👉 Like, 💬 Comment, 🔔 Follow & ✅ Join us for more real-time updates!
Let’s ride the waves smart. 💸
— Posted by Livia 😜

huge buy (probably)!Hello friend. I wanted to 51 R:R trade open. if it will be ok it would be my new record. lets see what happened. be happy and have a great time(wink)

2/4/26This pattern is similar to many other altcoins that shot up from such a formation, plus the weekend has begun, which means there is potential for reduced volatility in Bitcoin and growth in altcoins.

MR President - When $16?How can we forget Mr TRUMP!!!!!?? The marker mover hahaha, so unless price is likely to stay above 9.148 unless there’s heavy sellingm< weekly looks positive but not lookinh onto those shi

Buy OPP.Hello all. I'm not a crypto trader but for the firs time I'm going to trade. does anyone have an idea about?

Trumpcoin long to $9.671 todayGm peeps. Just woke up and decided to go long on Trumpcoin. Been watching it since last night.
It got a big selloff then it was bought up aggressively, flipping bullish on 1hr tf and breaking 4hr resistance areas.
So the bulls are gaining control and today with US session volume I anticipate another aggressive move to the upside based on my DTT analysis.
Stop: $9.315 or lower
Target: $9.671 area
potential early close around $9.563
Time sensitive


trumpusdtAnalysis of the Trump/USD pair on the hourly time frame. The analysis is based on trend analysis, support and resistance.

Trump buy and sell analysisTrump buying and selling levels.
Buy at these 2 levels (7 and 9) and sell at 3 levels given
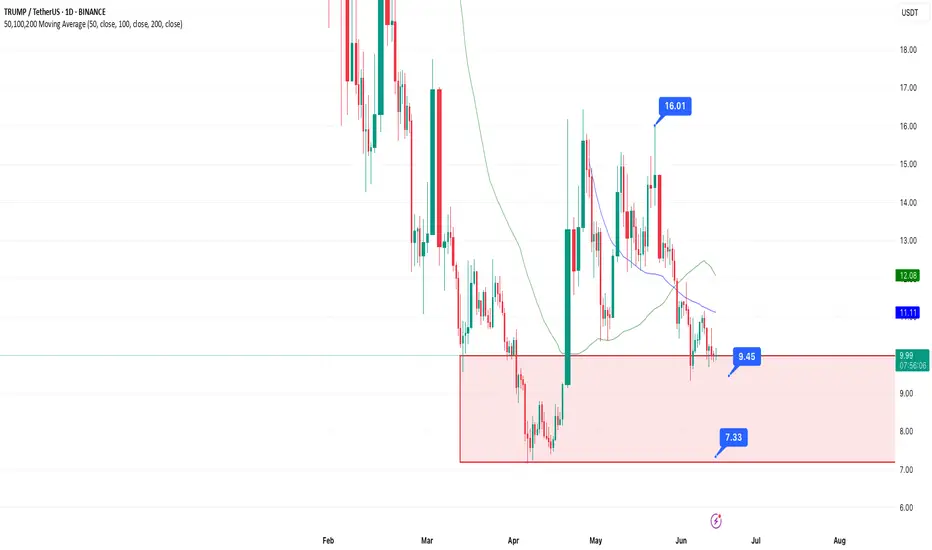
TRUMPUSDT In my opinion, we could still see a further 10% drop, considering the market’s cyclical nature — though it does feel like we’re near the bottom at this point.
Based on the indicators below, MACD and CCI are also showing signs of compression, similar to what we're seeing in the technical analysis.
Overall, I think by June 20th we’ll have a clearer picture of where the breakout from these triangle formations is headed

Trumpcoin long Just recently opened a long position on Trump. Targeting $11.4-$11.889 area
Time sensitive.
For context as well- Cpi news just came out with cpi readings 2.4% which is below expectation of 2.5%
Going based on the price action and my edge separate from news the market looks like it wants to pump

Trumpcoin longI think the market will attempt to break daily structure bullish on Trumpcoin today. Took a long trade on it.
Tp 11.367
Time sensitive. Might correct but likely won't by much I reckon.

Potential BuyTrump coin has a visible IH&S, with the right shoulder slowly forming.
The buy would be good at the current point with the stop loss slitely below the left shoulders candle.
Trump's signalHello friends🙌
🔊Given the good growth we had, you can see that the price has hit resistance and you can see that the upward waves are getting weaker, which indicates that we are likely to have a correction until the support areas are identified...
You can buy in the identified support areas in steps and with capital management and move with it to the specified targets.
🔥Join us for more signals🔥
*Trade safely with us*
Live Trump TradeHello friends
Based on the analysis and research we have concluded that it is possible to enter into a transaction with risk and capital management, given the entry of buyers and the price pullback.
*Trade safely with us*

Trump coin long back to $10.7 Today#trumpcoin conservative long...maybe experience a bit of drawdown
🎯Tp: $10.7
🛑Stop: $10.17
💰Roughly 2.35RR
#Trump

TRUMP to $100? Code 144 and Trump's Birthday I want to share my unique hypothesis, which no one has discussed before. I noticed an interesting pattern: on the 144th day after listing, a pump began for meme tokens like SHIB, PEPE, DOGE, FLOKI, and BABYDOGE.
I call this "Code 144" — and I believe the same scenario could repeat with the TRUMP token, especially considering June 14th is Donald Trump's birthday. This is the perfect media opportunity to trigger a FOMO wave, especially if it coincides with this critical 144th day.
📌 What’s important:
The same pump pattern on these coins' charts (possibly controlled by the same market maker);
TRUMP is currently in an accumulation phase;
The US election hype could amplify the effect;
I expect a pump near June 14th, as part of the "Code 144."
The target for TRUMP, based on this scenario, is $100 as a short-term spike due to the hype.
⛔ This is not financial advice, but my personal idea based on observing past cycles of meme tokens. I’m sharing it to document the hypothesis and check it against time.
