$TRUMP Forming Ascending Triangle – Breakout Watch📈 $TRUMP – Ascending Triangle Watch
On the 4H timeframe, $TRUMP is consolidating inside an ascending triangle 🔺 — a pattern that typically points to bullish continuation if resistance is broken with conviction.
📊 The structure is tightening — watch closely for breakout signals with volume.
⚠️ A strong move from this zone could trigger fresh momentum.
👀 Stay sharp — this setup is heating up!
TRUMPUSDT trade ideas
TRUMPPPPPPPPPPPPPPPPPPPHello friends
Considering the good growth we had, you can see that the price formed a flag and corrected after reaching its ceiling.
Now, with the price correction, there is a good opportunity to buy in stages and with capital management and move towards the specified goals.
*Trade safely with us*

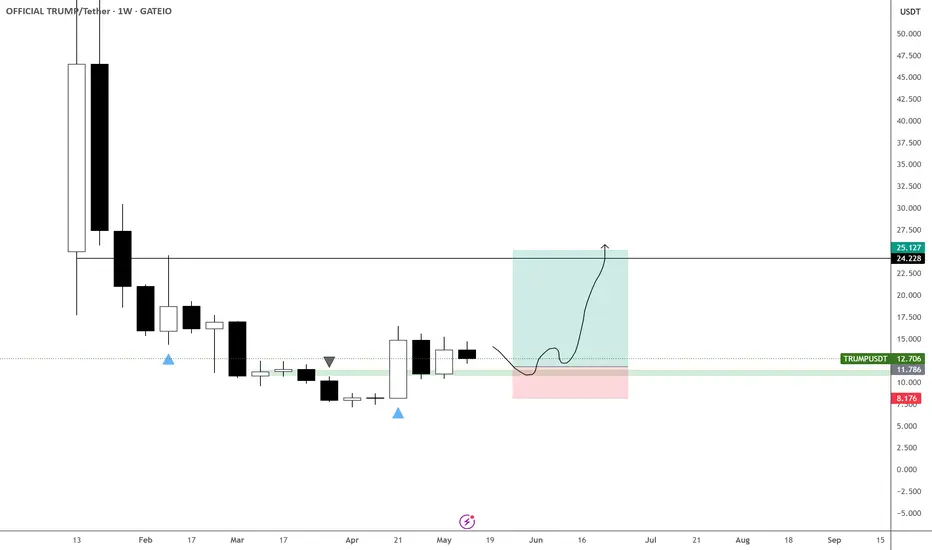
TRUMPUSDT Massive breakout above the Triangle.Official Trump / TRUMPUSDT just crossed above its 1 month Triangle pattern following a May 6th rebound on the 1day MA50.
The upside potential is huge long term but even in the immediate future, it technically targets the 2.0 Fibonacci extension.
Buy and target 25.50.
Follow us, like the idea and leave a comment below!!

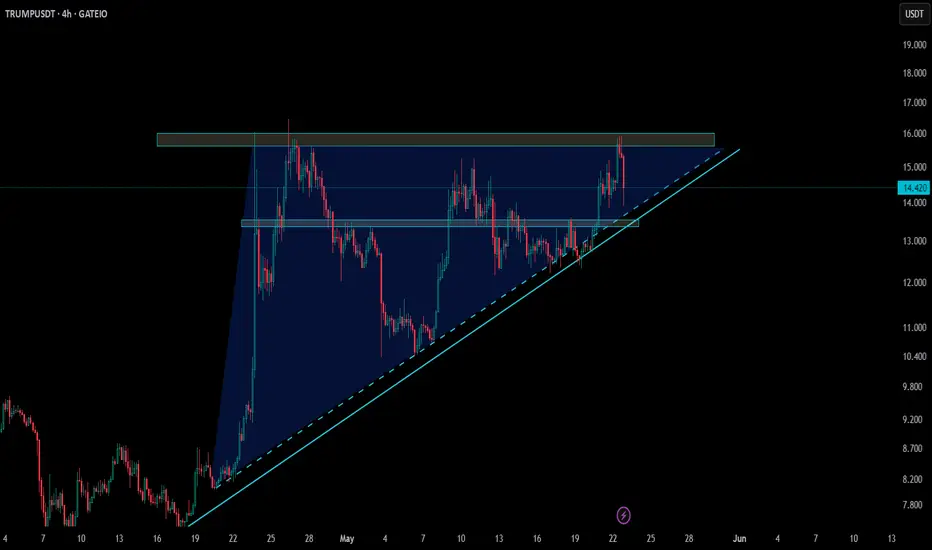
TrumpCoin Eyes Major Breakout: $0.16 Resistance in FocusTrumpCoin is approaching a critical resistance level at $0.16, and a breakout here could set the stage for a rapid move towards the $0.24–$0.25 zone. The price action over recent weeks has been structurally bullish, with a clear series of higher lows forming a strong upward trajectory.
Each higher low has bounced cleanly off the 0.618 Fibonacci retracement, signaling technical respect for key levels and underlying buyer strength. This recurring Fibonacci behavior reinforces a well-defined uptrend that is currently coiling just beneath resistance.
The $0.16 resistance level marks a major inflection point. A decisive break above it would confirm the bullish structure and open the door to further upside, with a measured move targeting the $0.24–$0.25 range.
From a technical perspective, TrumpCoin is exhibiting a strong continuation pattern. The consistent higher low formation, combined with Fibonacci confluence, gives increased probability to an upside breakout—provided the $0.16 ceiling is cleared with volume and momentum.

$TRUMPTRUMP is currently consolidating above the 25 EMA on the daily timeframe.
As long as the $12 daily support holds, I expect a move toward the marked mid-term targets.
DYOR

TRUMPUSDT – RSI Bounce & Symmetrical Triangle BreakoutTRUMPUSDT is showing a strong technical setup on the 8H timeframe, with bullish confirmation from both momentum and pattern breakout.
✅ Key Technical Signals:
RSI 50 Bounce: Price recently bounced off the RSI 50 midline, a classic sign of a continuation of bullish momentum.
Symmetrical Triangle Breakout: We've broken out above the triangle resistance, suggesting a potential trend reversal or continuation to the upside.
📈 Trade Setup:
Entry: On confirmed triangle breakout.
Stop Loss: Just below recent structure at 13 USDT — the price before breakout confirmation.
Take Profit Targets (Fibonacci Levels):
🎯 TP1 – 0.236 Fib: 24.260 USDT
🎯 TP2 – 0.382 Fib: 34.854 USDT
🎯 TP3 – 0.5 Fib: 43.905 USDT
🎯 TP4 – 0.618 Fib: 52.956 USDT
🎯 TP5 – 0.786 Fib: 65.371 USDT
⚠️ Always use proper risk management. Not financial advice – DYOR.

TRUMPNow my eye on BTC but also I`m waiting reactions of the meme community. One of the potential motherfucker for this run is a Trump Official. Will be catching for LONG position on retest of channel. If we bounce and keep accelerating for me that will be a green light.
NFA - DYOR

$TRUMP bottomed...Interesting setup in the official meme coin launched by POTUS #47.
My suggested stop is quite tight compared to potential upside.
Yuge rr in this trade.
Best of luck!
Cheers,
Ivan Labrie.

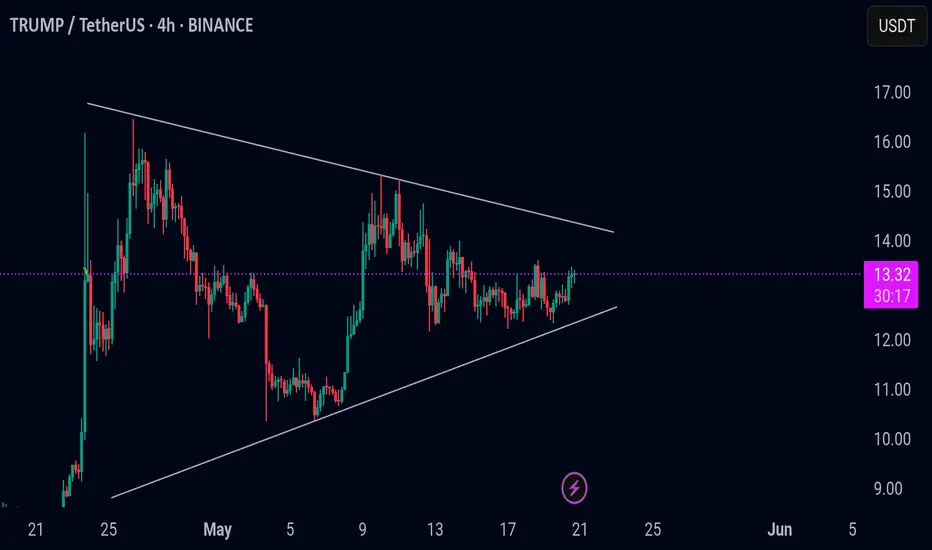
Trump/Usdt Plan Trump is trading inside a symmetrical triangle. If the price pumps and breaks out of the triangle, bullish momentum may follow. Otherwise, if the price dumps and breaks down from the triangle, bearish momentum may follow. Wait for a triangle breakout to confirm the next direction. Keep eye on it
TRUMP is Back on the Move! Breakout Trade Setup Inside!!🚀 TRUMP Bull Pennant Breakout – 40% Potential Incoming?! 👀🔥
Hey Traders! If you're all about high-conviction plays and real alpha, smash that 👍 and tap Follow for more setups that actually deliver! 💹💯
TRUMP is breaking out of a symmetrical triangle in the 4H time frame — signaling the potential for a massive upside move! The last time we saw similar consolidation, it exploded with over 40% gains.
📈 Entry: Current Market Price
🎯 Target: $18.70+
🛑 Stop Loss: $12.58
Lev: Use low lev (Max 5x)
📊 Risk/Reward: High-reward setup for breakout traders
🔥 With momentum building and volume picking up, this setup could deliver strong returns if the breakout sustains.
💬 What are your thoughts on this move? Are you trading $TRUMP?

TRUMP COIN 4H TRADE PLANS.Currently ranging but its different from other alts coins because of its manipulation. So i will stay away from this coin in marked area and long short areas are also marked.

TRUMPUSDT 12H Analysis TRUMP ~ 12H Analysis
#TRUMP Buy after successfully breaking this resistance line or buy when retesting this support block with a short-term target of at least 10%++

TRUMP 4X Lev. Full PREMIUM Trade-Numbers (PP: 1266%)The market always offers a second chance... Good evening my fellow Cryptocurrency trader, look what I have for you!
This is definitely one of your favorite Altcoins, a memecoin, and I want to give you great numbers right now.
This is very, very, very simple. Just buy and hold.
This is a high probability trade-setup but still kind of risky because the action is happening "mid-air." But this is great timing, I believe because only the market can decide about this.
If you don't know what the below numbers mean, you can skip them all together and just go spot. To go "spot," buy as much as you can. "Buy as if the world is ending tomorrow." "Buy like is the end of the world —and hold." That's the greatness of spot, you can't go wrong.
For more advanced and experienced trader, I am wishing you tons of profits and success. Full trade-numbers below:
_____
LONG TRUMPUSDT
Leverage: 4X
Entry levels:
1) $13.80
2) $12.65
3) $11.20
4) $9.85
Targets:
1) $15.8
2) $17.9
3) $20.8
4) $24.5
5) $28.6
6) $31.2
7) $35.3
8) $42.0
9) $46.7
10) $52.7
Stop-loss:
Close weekly below $9
Potential profits: 1266%
Capital allocation: 3%
_____
Remember, while I believe this is a great setup with great prices and great timing, market conditions can always change. If you cannot handle the weight of your actions, do not trade.
Only use money you can afford to lose.
Plan ahead. There is always risk involved.
With that said, get ready for another successful leveraged trade.
Thank you for reading.
I love you—your support is highly appreciated.
Namaste.

TRUMP – Prepping for a Strong Move - $25 incoming!TRUMP is setting up nicely for a potential breakout.
After reclaiming the 10.8–11.5 zone, it's been accumulating well within this new range—signs are pointing toward continuation.
Another week of consolidation at these levels could lead to a strong impulse move by month’s end.
Targeting first exit at $24, followed by $45 if momentum turns euphoric.
$TRUMP BINANCE:TRUMPUSDT
Bounce or Bust at $12.50?TRUMP is currently trading at $12.86 on the 4-hour chart. Over the past few days, the price has been consolidating after hitting a recent high, hinting at potential upward momentum. However, recent price action shows a breakdown from a symmetrical triangle pattern, which could signal bearish pressure in the short term. Despite this, the token is holding at a key horizontal support zone around $12.50. This level is critical, if it holds, we might see a stabilization or recovery; if it breaks, further downside could follow.
From a technical perspective, the 4H chart presents a mix of signals. The breakdown from the symmetrical triangle and the formation of a descending triangle lean bearish, but there’s also evidence of a falling wedge breakout, a pattern that often precedes a bullish reversal. Traders should keep an eye on the $12.50 support, failure here could push the price lower. On the flip side, a strong 4H close above $14.725, backed by solid volume and rising open interest, could confirm a bullish shift. These levels are your key markers to watch for the next move.
In the news, Trump’s cryptocurrency ventures are stirring interest. His World Liberty Financial project recently made waves with a $2 billion investment in Binance using a stablecoin, which might indirectly boost confidence in TRUMP. There’s also buzz around the $TRUMP meme coin, with top holders splashing out big sums for exclusive Trump-related perks. While these developments don’t directly dictate price, they add a unique layer to TRUMPUSDT’s market dynamics and could influence sentiment moving forward.
In summary, TRUMP sits at a pivotal point. The technicals suggest both downside risks and upside potential, hinging on how the price reacts at $12.50. Combine that with Trump’s crypto headlines, and you’ve got a token worth watching closely. Traders should stay nimble, monitor those support and resistance levels, track volume, and keep an ear out for any fresh updates from Trump’s camp. A bounce or a breakdown could be just around the corner.

Trump 100% Massive Pump SoonChose your path either way the triangle brings us to $23-$4
Even a breakdown of the triangle will make us wick down to $10, but it;s back by support and we go up right after.

Ticket to Trump's dinnerI really don't know and even care what is this. They just said who get enough of $TRUMP those may have a chance to be invited at the President Trump Annual Holders Dinner at White House or whatever

OFFICIAL Trump: Should I Sell Everything Now?Notice how interesting this is, while TRUMPUSDT peaked 26-April, the "higher low" on the chart remains untested, that is, this trading pair is consolidating while staying sideways.
While there was a lower high 10-May compared to 26-April, there is no strong retrace. TRUMPUSDT is trading high up.
This is not the time to sell, no. This is the time to buy, buy strong and hold because not only OFFICIAL TRUMP but everything Crypto will grow.
The longer the consolidation (sideways) period, the stronger the bullish wave that follows. In fact, it is good that TRUMPUSDT is sideways now and working to gain strength. This means that the project is preparing for a massive bullish wave. This wave will happen next in a matter of time, can be a week from now... Prices will be moving higher for certain, patience is called for.
Namaste.

TRUMPUSDTi Observed these Levels based on Price Action and Demand & Supply which is my own Concept "PENDAM CONCEPTS"... Please don't take any trades based on this chart/post... Because this chart is for educational purpose only not for Buy or Sell Recommendation... Thank Q

Price squeezes into triangles before flying to the moon ?In this idea I marked the important levels for this week and considered a few scenarios of price performance
Price is in triangles now and it is important to consider the risks at the resistance zone and at the uptrend line
Write a comment with your coins & hit the like button and I will make an analysis for you
The author's opinion may differ from yours,
Consider your risks.
Wish you successful trades ! mura

$TRUMP BREAKOUT - Short EntryOn the 1hr chart, we saw that $TRUMP consolidated from 9th May and has broken out of the box. Looks like it’s a gonna drop. Trade with caution
Please support this idea with a LIKE👍 if you find it useful🥳
Happy Trading💰🥳🤗

Trump Asset Eyes 20% Surge Toward $17 – Breakout ConfirmedHello and greetings to all the crypto enthusiasts, ✌
All previous targets were nailed ✅! Now, let’s dive into a full analysis of the upcoming price potential for Trump's officia l 🔍📈.
Last month, Trump's official successfully broke above its descending channel and has since completed a clean retest of the breakout zone. The technical structure remains bullish, and current momentum supports a potential continuation toward the $17 level—reflecting an estimated 20% upside from here. 📊🚀
🧨 Our team's main opinion is: 🧨
After breaking out of its descending channel and retesting successfully, this Trump shows bullish momentum with a 20% upside potential toward the $17 target. 📈
Give me some energy !!
✨We invest hours crafting valuable ideas, and your support means everything—feel free to ask questions in the comments! 😊💬
Cheers, Mad Whale. 🐋

TRUMP and Key ResistanceAfter pumping aroun 10%, now on resistance level, if we can break we can see price around 15 soon
