TRUMP - BE STRONG!BE STRONG TRump! TRIUMPH all the buyers and sellers! I mean all buyers who are stuckk at 75! Okay so nPoC test of another dollar is needed before again sideways momement or any news struck it hard!
TRUMPUSDT trade ideas

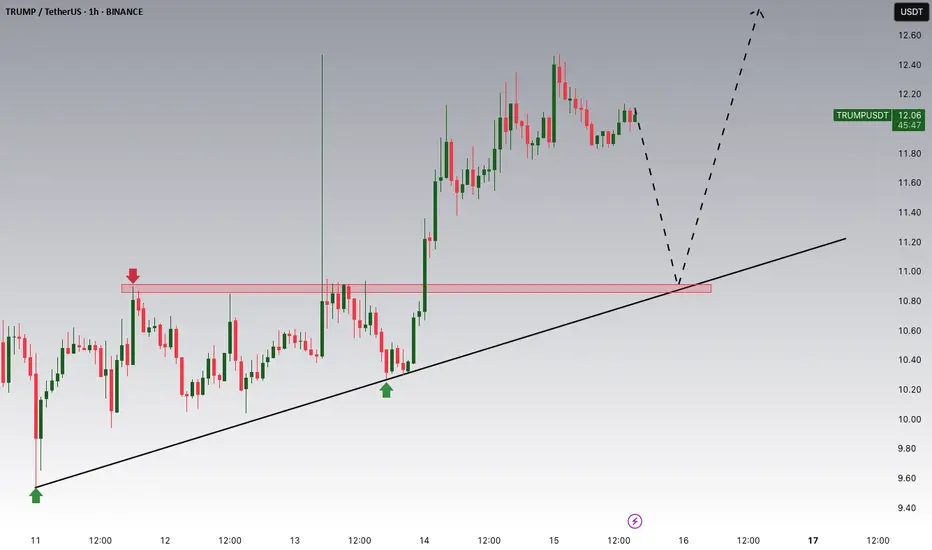
TRUMP Is Trying To SpikeHey Traders, in today's trading session we are monitoring TRUMPUSDT for a buying opportunity around 11 zone, Trump is trading in an uptrend and currently is in a correction phase in which it is approaching the trend at 11 support and resistance area.
Trade safe, Joe.
Trump signal⭐ Future Trading Signal ⭐
Exchanger: Bybit/Binance/
LONG 📉
Pair: TRUMP/USDT 🪙
Leverage: 10-25X 🔷
Entry Limit: 11.855
Take Profit Targets:
💰 TP: 12.464
Stop Loss 😡: 11.733
Good luck!
🚨DON'T BE GREEDY🧏🚨

TRUMP DAILY TIMEFRAME UPDATE (ON DEMAND) ❤️ THIS POST AND I WILL SHARE NEXT pair
$TRUMP are now freely tradeable on the blockchain. On July 13, 2024, President Trump faced death and came up fighting
ANY THOUGHTS ON $TRUMP ?

TRUMPUSDT after another -50% dump big pump expected(+550%)We are looking for range zone and maybe more dump for price soon but these two support zones specially 5$ support zone can easily pump the price to the target like 30$ and there is good Buy opportunity there and my major support would be there for this dump.
DISCLAIMER: ((trade based on your own decision))
<<press like👍 if you enjoy💚

TRUMPUSD compared to other meme projectsWe're about to have the last big plunge and if you needed any further justification to get into trump coin, looking at how other meme project's price responded in the following year they were launched may give you some insight into how this is going to play out. Massive massive gains friends.
Going long at $3-$5 depending on what i see bitcoin doing relatively.
Trade Responsibly. ;)

TRUMP COIN WILL FLY HIGH TRUMP COIN NEW OUTLOOK
according to H4 analysis trump coin is in falling pressare since few day now trump market at support level it will be revarse from support zone TRADE AT YOUR OWN RISK
ALBERT
Trump 1moreSmall retrace down to 12-.82 my view then
A great move back for lob up, dm on x for tools

TRUMP ANNOUNCEMENT!TRUMP TRUMP! He is ruling the market and is the liqudity! How you know to know to do what?? I know his mind so i am telling you, plan from the red box for any liquidity sweep buying and stances are top, as previous mentioned did go 20 but have huge potentials!

OFFICIAL TRUMP 8X Trade-Numbers (3,656%)Patience is absolutely necessary. This is the same chart setup we have been tracking for months now. Well, weeks actually. And this is a good chart setup.
The fact that the project is heavy, a big market cap., makes it harder to manipulate, but, whales are still whales and they can easily shake the market at all times.
When in doubt, reduce leverage.
We are doing high leverage, high risk. You can use this same chart setup with 3-5X and have very low risk. You can use this same chart setup with 15-20X and have extreme high risk. The numbers are for illustration purposes only. Leveraged trading is for advanced traders. That is, the player needs to be able to adapt to market conditions and adapt the numbers to personal conditions.
Needless to say, if you have a strong track record and capital you can use higher risk. If you have a record of being nervous and anxious and making simple mistakes then you must go with spot or 1-2X. Remember, if you can't make money trading spot, you won't be able to make money trading lev. Spot trading is like chess. Strategic and advanced. Leveraged trading is like 5D chess, the complexity goes off the chart. But we can keep it simple.
Find the right chart, buy and hold.
If you keep the risk small you can have an easy win. You are responsible for your own actions.
If you cannot handle a big win, then do not trade.
If you cannot handle a simple loss, please, go away.
It is unproductive to blame others for your mistakes. You move the mouse, you make the deposits, you choose which pair to buy, by how much and when. If you cannot bear the weight of your actions, do not trade.
If you can... Welcome to TradingView.
Here you have the full trade-numbers for TRUMPUSDT. Great timing. Great chart setup, medium-risk. An extremely high potential for profits.
_____
TRUMPUSDT
Leverage: 8X
Entry levels:
1) $14.0
2) $12.5
3) $11.7
Targets:
1) $16.2
2) $19.4
3) $21.7
4) $24.6
5) $27.8
6) $29.7
7) $33.0
8) $38.1
9) $41.8
10) $46.5
11) $60.1
12) $73.6
Stop-loss:
Close weekly below $11.65
Potential profits: 3656%
Capital allocation: 3%
_____
This is life. I am life. I love this life and this world.
Thanks a lot for your continued support.
As long as you persist and learn from all the actions that you make, good or bad, you will improve and you will succeed in this game.
Nothing can stop you. You are bound to achieve success.
The only way to lose is to give up.
I can never give up.
I will never give up.
I will only take a break to recharge and reload.
When I am refreshed and ready, I am trading once more.
This time around, I am taking the money home.
Namaste.

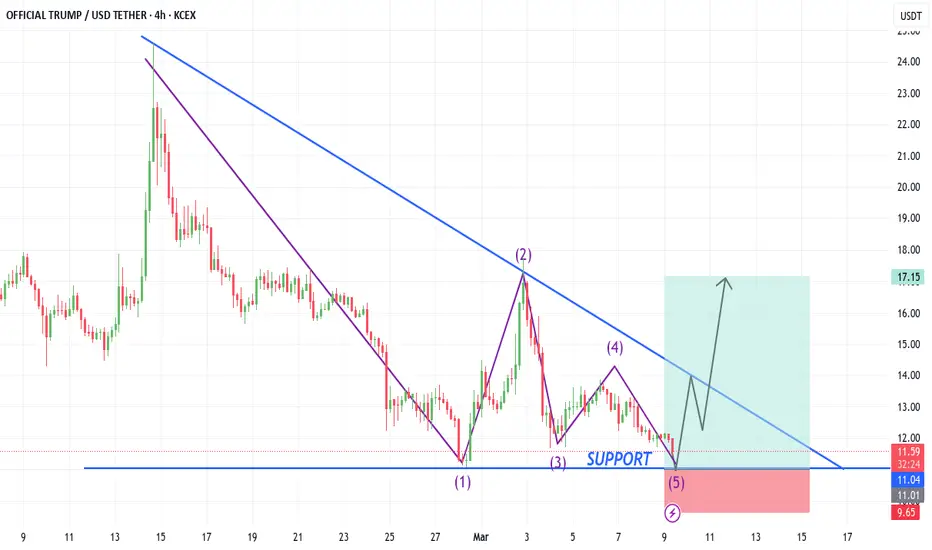
OFFICIAL TRUMP: Bullish Potential Invalidated? Back To 1,000%+As can be seen here, price action moved below our defined support (now resistance). The question naturally arises, is the previous analysis now invalid? Quick answer, no! We are still bullish and I will explain why.
It is true that the break above resistance makes this chart ultra-bullish, so moving back below can be considered an invalidation. The truth is that the low yesterday is still a higher low compared to 28-Feb. when the All-Time Low was hit. We have both a higher low and also a green close, the session yesterday ended green as a hammer which is bullish.
The bullish case is weaker now in the short-term but the bullish bias and potential remains intact. TRUMPUSDT is set to grow; patience is key.
The low is in and this low was followed by a high volume bullish breakout. This breakout is followed by a retrace, which is a classic and this retrace ends as a higher low. This is standard price action. From this higher low TRUMPUSDT can and will grow.
Even if the market decides to shakeout more people out, we are bullish long-term. You know what I love to say; once we hit bottom, the only place left to go is up.
Notice in early 2025 there is a clear downtrend on the chart. Now, instead of a downtrend the action is sideways. This is the transition period. First down, then sideways and then up.
We are going up next. It can take a few months, a few weeks or simple just a few days.
The potential for growth here is as good as with any other pair.
Thanks a lot for your continued support. It is truly appreciated.
Namaste.

TRUMP/USDT(BUY)hello friends
Due to the correction of the price and the breaking of the resistance, we can now buy with risk management and move to the specified goals.
*Trade safely with us*

Small Bullish MoveTrump/Usd as formed a W or double bottom structure which will move from 13.27 all the way to the TP at 16.92

$TRUMP Market Update📊 $TRUMP/USDT Market Update
Welcome to today's analysis! Let’s break down the current price action on $TRUMP and what to expect next.
🌐 Overview: $TRUMP Approaching Key Resistance
📉 $TRUMP was in a downtrend after breaking a key support level. Now, the price is approaching the red resistance zone, which was previously a support level before the strong breakdown.
🔄 Current Scenario:
The red resistance zone is a critical level that needs to be broken for a trend shift to bullish.
If $TRUMP successfully breaks above this resistance, it could confirm a bullish trend, with the next target being the blue line level.
However, if price gets rejected, we could see another pullback or consolidation before another breakout attempt.
🔑 Key Levels to Watch
🔴 Resistance Zone: Red Level (Needs breakout to confirm bullish momentum)
🔵 Target Level: Blue Line (If breakout is successful)
🛠️ Trade Scenarios
📌 Bullish Scenario (Breakout Above Red Resistance)
If $TRUMP breaks and holds above the red resistance zone, this would confirm bullish momentum and a potential move toward the blue line target.
📌 Bearish Scenario (Rejection at Resistance)
If $TRUMP fails to break out, we could see a pullback or consolidation, meaning the downtrend could still continue.
📌 Conclusion
$TRUMP is at a key resistance zone—a breakout could confirm a bullish trend, targeting the blue line level, while a rejection may lead to further downside movement. Traders should watch for confirmation before making a move.

trumpMy personal take is this: We have a support box that has been identified and if it breaks for any reason, it can go all the way to the blue lines, but whatever high it makes in the short term, we need to see what it does to the red lines.

Trumpty Trumpty Dumpty, Pumpty so tall
Trumpty Pumpty, We are so back!
Said They All
Trumpty Pumpty, I
Expected said Fall
Trumpty Pumpty,
You get it yet, doll?

#TRUMP/USDT#TRUMP
The price is moving in a descending channel on the 1-hour frame and is expected to continue upwards
We have a trend to stabilize above the moving average 100 again
We have a descending trend on the RSI indicator that supports the rise by breaking it upwards
We have a support area at the lower limit of the channel at a price of 12.50
Entry price 13.00
First target 13.53
Second target 14.31
Third target 15.06


OFFICIAL TRUMP: It Is Still Early 4 773% —111% & 333% Short-TermIt is still early. Great news.
In this chart we have a classic, the stop-loss hunt event.
TRUMPUSDT moved below support just to quickly recover. Support here is mapped as the 10-February low. The break above support produced a really strong, full green candle with really high volume.
This is a confirmed bullish breakout.
It is still early.
It is still early because of the stop-loss hunt event. The stop-loss hunt event only happens at bottom prices. Even though there was a strong move, relatively speaking (reading-writing), this move produced a recovery from a true bottom. Now that the action is happening above support, we can expect a bullish wave to develop.
The chances for lower prices are really low. Don't get me wrong, it is still possible to see a shakeout, another one, but this is very unlikely. Notice how high the volume is when prices move up. Now, notice how low the volume is when prices move down. The bears have no force, no momentum, no excuses left. In fact, many people were selling Bitcoin and many Altcoins at the bottom and now they have to buy at higher prices. They will never sell. Those that were already holding strong, won't sell either. We are all ready to hold.
The market is going up which is great news for all those involved.
Here we have a nice 773% target. It is still early.
We have an easy target at $34 for 111%.
Another target around $70 yields 333%.
Patience is key. Our strategy stays the same.
Accumulate as much as you can and then wait.
Each time you get paid, the money goes into Crypto; the market will take care of the rest.
Thank you for reading.
Namaste.

Trumpty Pumpty had , will have a Great Fall.Trumpty Pumpty Sunday was a ball,
Trumpty Dumpty shall follow a fall.
Anyone miss the plot¿ MarketMakeriQ iQ PRO and 4ALL Kits coming public view here for you. A library so large it will take time. But you know it all good cuz that means we have more time to rhyme -
Advm see ya down at entry !

Trump New Update (2H)It seems that the TRUMP symbol is forming a Diametric pattern and is currently aiming to complete wave F.
As long as the green zone holds, the price can move toward the red box.
A 4-hour candle close below the invalidation level would invalidate this analysis.
For risk management, please don't forget stop loss and capital management
Comment if you have any questions
Thank You

TRUMP coin update#TRUMP is making a clear pattern of a reaction to supply zone which gives us a confirmation line i think that if this line be broken then the market will rise to the higher prices at least to the next supply zone

TRUMP update#TRUMP crossed the confirmation line so the next target can be the next supply zone also we have a W harmonic pattern which the price hit its fibo level i think that this coin has a perfect potential for rising its better to wait and see what will happen next !
