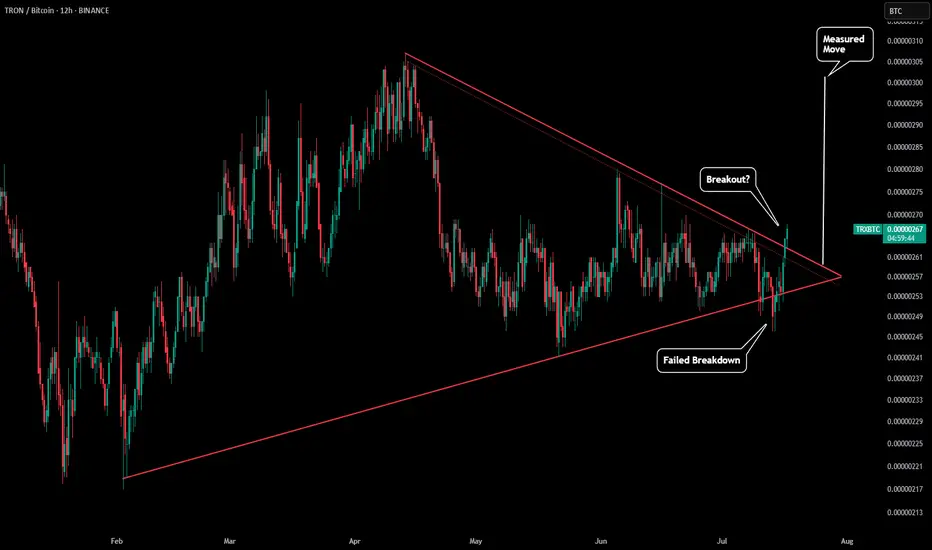
TRX/BTC - Trying to BreakoutWe have already seen the TRX/USD chart breakout (as seen in our previous post), but now the BTC pair is trying to breakout to.
On the daily chart we are trying to get above our downwards sloping red resistance line. It is possible we retest, but if this breakout continue that could push the BTC pair to above $0.000003 +. This is inline with our measured move (white line) and also where the symmetrical triangle started.
TRXBTC trade ideas
TRX Breakout vs BTC? Is a TRX explosion in price action imminent? TRX one of the few assets not only surviving vs BTC but looks poised to breakout in a massive ascending wedge. Push for Stablecoins and the TRX public listing through merger. Potential ETF rumors. IS TRX really in position to explode?
USD charts looking rather promising as well. BTC corrections haven't impacted TRX path up. I'm starting to think this one could go on a pretty MASSIVE run in the event of breakout. Trump and JS buddy buddy system lately, SEC dropping charges, etc, etc. TRXs time to shine?
TRON / Bitcoin Cryptocurrency | Chart & Forecast SummaryKey Indicators On Trade Set Up In General
1. Push Set Up
2. Range Set up
3. Break & Retest Set Up
Notes On Session
# TRON / Bitcoin Cryptocurrency
- Double Formation
* 012345 | Wave Count | Completed Survey
* ((Wedge Structure)) | Subdivision 1
- Triple Formation
* Retracement Not Numbered | Support | Set Up | Subdivision 2
* Retracement Numbered | Uptrend Bias | Subdivision 3
* Daily Time Frame | Configuration
Active Sessions On Relevant Range & Elemented Probabilities;
European Session(Upwards) - US-Session(Downwards) - Asian Session(Ranging)
Conclusion | Trade Plan Execution & Risk Management On Demand;
Overall Consensus | Buy

TRX BTC back in range, rejected from top rangeTRX pump did not change anything and brought TRX back into accumulation range

Analyzing TRXBTC: Next Potential Breakout Zones - TRON◳◱ On the $TRX/ CRYPTOCAP:BTC chart, the Bband Breakout Super-Trend pattern suggests a pause in volatility, potentially gearing up for a breakout. Traders might observe resistance around 0.00000219 | 0.00000225 | 0.00000239 and support near 0.00000205 | 0.00000197 | 0.00000183. Entering trades at 0.00000217 could be strategic, aiming for the next resistance level.
◰◲ General info :
▣ Name: TRON
▣ Rank: 12
▣ Exchanges: Binance, Kucoin, Huobipro, Mexc, Kraken, Hitbtc
▣ Category/Sector: Infrastructure - Smart Contract Platforms
▣ Overview: TRON is a multi-purpose smart contract platform that enables the creation and deployment of decentralized applications (dApps). It features a delegated Proof-of-Stake (DPoS) consensus mechanism, a system that offers an increase in performance while maintaining true decentralization and censorship resistance.
TRON is arguably most famous for its low cost ability to make transactions in comparison to other layer-1 solutions such as Ethereum, though still lags behind in developer adoption to be considered a serious rival yet.
◰◲ Technical Metrics :
▣ Mrkt Price: 0.00000217 ₿
▣ 24HVol: 56.806 ₿
▣ 24H Chng: 0.93%
▣ 7-Days Chng: -1.53%
▣ 1-Month Chng: 24.15%
▣ 3-Months Chng: 32.47%
◲◰ Pivot Points - Levels :
◥ Resistance: 0.00000219 | 0.00000225 | 0.00000239
◢ Support: 0.00000205 | 0.00000197 | 0.00000183
◱◳ Indicators recommendation :
▣ Oscillators: NEUTRAL
▣ Moving Averages: STRONG_BUY
◰◲ Technical Indicators Summary : BUY
◲◰ Sharpe Ratios :
▣ Last 30D: 4.10
▣ Last 90D: 2.80
▣ Last 1-Y: 1.85
▣ Last 3-Y: 0.71
◲◰ Volatility :
▣ Last 30D: 0.65
▣ Last 90D: 0.42
▣ Last 1-Y: 0.39
▣ Last 3-Y: 0.53
◳◰ Market Sentiment Index :
▣ News sentiment score is N/A
▣ Twitter sentiment score is N/A
▣ Reddit sentiment score is N/A
▣ In-depth TRXBTC technical analysis on Tradingview TA page
▣ What do you think of this analysis? Share your insights and let's discuss in the comments below. Your like, follow and support would be greatly appreciated!
◲ Disclaimer
Please note that the information and publications provided are for informational purposes only and should not be construed as financial, investment, trading, or any other type of advice or recommendation. We encourage you to conduct your own research and consult with a qualified professional before making any financial decisions. The use of the information provided is solely at your own risk.
▣ Welcome to the home of charting big: TradingView
Benefit from a ton of financial analysis features, instruments and data. Have a look around, and if you do choose to go with an upgraded plan, you'll get up to $30.
Discover it here - affiliate link -

Tron (TRX) completed a setup for upto 20.50% pumpHi dear friends, hope you are well and welcome to the new trade setup of Tron (TRX).
Previously we caught 10% pump of TRX as below:
Now on a daily time frame, TRX with Bitcoin pair has formed a bullish Cypher move for the next pump.
Note: Above idea is for educational purpose only. It is advised to diversify and strictly follow the stop loss, and don't get stuck with trade.

Tron Bottom Signal (W Pattern)Good Sunday my fellow traders, let's look at TRXBTC today.
We have a classic "w pattern" on this 3D chart, which is equivalent to a double bottom.
This same pattern worked as a bottom back in early 2021 and something similar can happen here.
Bullish action has been happening for this pair since the start of the month.
Tron can detach from the market.
TRX has its own dimension, it can produce a chart that is completely unrelated to other pairs.
About 85-90% of all trading pairs in the Cryptocurrency market, and the rest of the world, have the exact same chart; this is due to bot trading, algorithms, etc. When a pair/project has a unique chart, this is always a positive sign.
➖ It means this is a real project;
➖ It means that there is real people/entities buying and selling;
➖ It means that something real is happening behind the scenes.
Regardless of the fundamentals, we still focus on technical analysis.
When a trading pair has a unique chart, it can move against the market; It can move first or last; everything is possible and this is good. It is good because there are always opportunities available if we know where to look.
We have good bullish action in the past 24 days but this doesn't mean that the pair will continue growing; no volume at this point is a tricky/mixed signal.
👉 Above "support" bullish.
👉 Below "support" bearish.
See the chart for more details.
Thank you for reading.
Namaste.

Major Tron TRXBTC BreakoutAll major levels have held. Trendline breakout with candle closes above last major resistance before ATH test.
TRXUSD to $10+

TRXBTCToday, I want to share my analysis and bullish perspective on the TRXBTC pair with you. After a thorough examination of current market dynamics and technical indicators, I have come to the conclusion that we are on the verge of a potential rise that could lead us to a specific target area, which I have marked on the chart.
Basis of Analysis:
Trend Analysis: TRXBTC shows signs of an uptrend within a certain timeframe. The formation of higher lows suggests an increasing buying interest.
Support and Resistance Zones: I have identified key zones that serve as significant support and resistance points. A breakthrough above these zones could pave the way for further gains.
Technical Indicators: Several indicators, including MACD and RSI, are showing bullish signals. In particular, the MACD is approaching a bullish crossover, while the RSI still has room to move up before overbought conditions are reached.
Market Sentiment and External Factors: In addition to technical analysis, I also consider the overall market sentiment and external influences that could affect the price movement of TRXBTC.
Trading Strategy:
Based on my analysis, I recommend a cautious approach. For those considering a long position, it might be advisable to wait for a clear breakthrough above the next resistance zone before entering. Set stop losses appropriately to protect your capital, and have target areas in mind to realize profits.
Risk Notice:
As with any trading decision, it's important to conduct your own research and follow a risk management strategy. The markets are volatile, and while the indicators may be bullish, there are no guarantees for future profits.
I look forward to your thoughts and discussions on this analysis. Let's monitor the developments together and learn from each other.

Could TRON #TRX 6X v #BITCOIN TRXBTC
has very good market structure
(higher high's , higher lows's)
for the past 3 years.
Overlooked , & under-appreciated it seems like, in my view on it's sentiment on Justin's success of network adoption.
We can see a clear Inverse head and shoulders
with a very key neckline level
that if broken with strength
could a indicate a run at the LOG target.
A disappointing TRX may only reach the linear target and not much beyond.
My TRXUSD chart which I am watching also does point to a stellar Bull market for TRX

$TRX/BTC 1W (#Binance) Falling broadening wedge retestTron printed a bullish hammer on 200MA weekly support, looks like a golden opportunity!
⚡️⚡️ #TRX/BTC ⚡️⚡️
Exchanges: KuCoin, Binance
Signal Type: Regular (Long)
Amount: 4.5%
Current Price:
0.00000233
Entry Targets:
1) 0.00000223
Take-Profit Targets:
1) 0.00000348
Stop Targets:
1) 0.00000173
Published By: @Zblaba
$TRX #TRXBTC #Tron #DPos #SmartContract
Risk/Reward= 1:2.5
Expected Profit= +56.1%
Possible Loss= -22.4%
Estimated Gaintime= 9-10 months
tron.network

Tron (TRX) completed setup for upto 16% pumpHi dear friends, hope you are well and welcome to the new trade setup of Tron (TRX) with BTC pair.
Previously we caught more than 10% pump of TRX as below:
Now on a daily time frame, TRX formed a bullish AB=CD move for the next pump.
Note: Above idea is for educational purpose only. It is advised to diversify and strictly follow the stop loss, and don't get stuck with trade.

📈📊 #ChartPattern Alert! 📈📊 📈 Falling Wedge 📈📈 What is a Falling Wedge? The Falling Wedge is a bullish chart pattern characterized by two converging trendlines, with the lower trendline sloping upward more than the upper trendline. It typically signals a potential bullish reversal, with the price likely to break upward after the wedge pattern.
📈 How to Identify:
Draw a trendline connecting at least two higher highs (upper trendline).
Draw another trendline connecting at least two higher lows (lower trendline).
📈 What it Signals: The Falling Wedge suggests a potential bullish reversal, with buyers gaining strength as the price reaches higher lows within the wedge. It often forms during downtrends and can precede a significant price move to the upside.
📈 Trade Strategy:
Consider buying when the price breaks above the upper trendline of the Falling Wedge.
Set profit targets based on the pattern's height added to the breakout point.
Implement a stop-loss to manage risk in case of a false breakout.
Remember to validate your analysis with other technical indicators and conduct thorough research before making any trading decisions. Happy charting and trading! 📈💹

TRON/BTC , Ascending triangle , timeframe 1 weekFormation of an ascending triangle on such a large timeframe.
Working out of the previous descending triangle is shown by red lines!
Price is clamped in the triangle, volumes are decreasing, there is a possibility of accumulation of coins before the breakout and achieving the specified goals
Thank you for your attention

📈📊 #ChartPattern Alert! 📈📊 📈 Rising Wedge 📈📈 What is a Rising Wedge? The Rising Wedge is a bearish chart pattern characterized by two converging trendlines, with the lower trendline sloping upward more than the upper trendline. It typically signals a potential bearish reversal, with the price likely to break downward after the wedge pattern.
📈 How to Identify:
Draw a trendline connecting at least two lower highs (upper trendline).
Draw another trendline connecting at least two lower lows (lower trendline).
📈 What it Signals: The Rising Wedge suggests a potential bearish reversal, with sellers prevailing at lower highs within the wedge. It often forms during uptrends and can precede a significant price move to the downside.
📈 Trade Strategy:
Consider short-selling or setting stop-loss levels if the price breaks below the lower trendline of the Rising Wedge.
Set profit targets based on the pattern's height subtracted from the breakdown point.
Implement a stop-loss to manage risk in case of a false breakdown.
Remember to use other technical indicators and conduct thorough research to support your analysis before making any trading decisions. Happy charting and trading! 📉💹

✳️ TRON Very Strong Chart Setup (Next Target Mapped)This is a very strong chart setup because we have so many classic signals working together pointing in the same direction.
Allow me a minute of your time and let's do this together.
TRON (TRXBTC)
Here a perfect EW impulse can be appreciated in blue (1,2,3,4,5).
Followed by a classic Zig-zag correction (ABC).
After the correction a new 5-Up bullish impulse develops and we have the first wave in the making.
This is happening above EMA10 and EMA21. We should see 5 waves total, a correction and then 5 more waves to complete an impulse of a higher degree which would lead to a stronger correction after the entire pattern is complete.
Our Elliot Wave theory analysis is supported by a bullish cross on the MACD.
And a strong RSI.
Finally, a short-term higher low is also in place.
All these signals together work beautifully and predict additional growth.
The next target around 0.0000040.
Thanks a lot for your continued support.
Namaste.

✳️ 40 Days Growing! Will Tron Continue Higher?The Tron vs Bitcoin (TRXBTC) pair has been growing since 12-April, for more than 40 days.
The RSI looks overbought or should we say strong?
Strong!
We can normally expect a retrace after so much growth but today's action looks like a continuation.
The high volume 20-May is a strong bullish signals.
✔️ We buy low near support and wait patiently for the breakout to happen.
✔️ We never buy/trade when the action is already on going... Well, sometimes we do but the risk is higher.
Namaste.

TRX-BTC20-May2023Daily bearish trend line broke to up
RSI bearish trend line broke to up
RSI broke limit of 70 = positive
MA 100 daily broke to up
CHoCH happened
Now we are in a gap area
weak bullish trend line in candle and RSI
S.L= Close under MA100 around 255
Inter more if = close with a goon candle up 266
TP= 290 not more for now , after that we should check again pattern to enter or dtay on btc

✳️ TRON vs BTC Changes Pattern | Potentially A Bullish SignalThis pair has been moving inverse to Bitcoin but now it seems to be moving together with Bitcoin... This is a big change.
When the dynamic of some pairs changes, this can signal that the overall market dynamic is changing as well or is about to change.
✔️ TRXBTC while in the bearish cycle moved inverse to Bitcoin.
✔️ TRXBTC now changing to become correlated with Bitcoin.
Can this tells us that Bitcoin is now entering a bullish phase?
Possibly.
We will have to wait and see but since the 1st of February, something changed.
The signal has been noted.
Namaste.

$TRX/#BTC [#TRON]: Resistance_Breakout◳◱ A Resistance Breakout has been identified on the $TRX / $BTC chart. The price has broken above a key resistance level, indicating a potential bullish trend. The next resistance key levels are located at 0.0000031 | 0.00000331 | 0.00000369, and the major support zones can be found at 0.00000272 | 0.00000255 | 0.00000217. Consider entering at the current price zone of 0.00000297 and targeting higher levels.
◰◲ General info :
▣ Name: TRON
▣ Rank: 17
▣ Category/Sector: Infrastructure - Smart Contract Platforms
▣ Overview: TRON is a multi-purpose smart contract platform that enables the creation and deployment of decentralized applications (dApps). It features a delegated Proof-of-Stake (DPoS) consensus mechanism, a system that offers an increase in performance while maintaining true decentralization and censorship resistance.
TRON is arguably most famous for its low cost ability to make transactions in comparison to other layer-1 solutions such as Ethereum, though still lags behind in developer adoption to be considered a serious rival yet.
◰◲ Technical Metrics :
▣ Mrkt Price: 0.00000297 ₿
▣ 24HVol: 43.464 ₿
▣ 24H Chng: 0.338%
▣ 7-Days Chng: -1.60%
▣ 1-Month Chng: 8.81%
▣ 3-Months Chng: 30.80%
◲◰ Pivot Points - Levels :
◥ Resistance: 0.0000031 | 0.00000331 | 0.00000369
◢ Support: 0.00000272 | 0.00000255 | 0.00000217
◱◳ Indicators recommendation :
▣ Oscillators: NEUTRAL
▣ Moving Averages: STRONG_BUY
◰◲ Technical Indicators Summary : BUY
◲◰ Sharpe Ratios :
▣ Last 30D: 2.48
▣ Last 90D: 2.59
▣ Last 1-Y: 0.49
▣ Last 3-Y: 1.00
◲◰ Volatility :
▣ Last 30D: 0.51
▣ Last 90D: 0.43
▣ Last 1-Y: 0.67
▣ Last 3-Y: 1.01
◳◰ Market Sentiment Index :
▣ News sentiment score is 0.57 - Bullish
▣ Twitter sentiment score is 0.49 - Bearish
▣ Reddit sentiment score is 0.64 - Bullish
▣ In-depth TRXBTC technical analysis on Tradingview TA page
▣ What do you think of this analysis? Share your insights and let's discuss in the comments below. Your like, follow and support would be greatly appreciated!
◲ Disclaimer
Please note that the information and publications provided are for informational purposes only and should not be construed as financial, investment, trading, or any other type of advice or recommendation. We encourage you to conduct your own research and consult with a qualified professional before making any financial decisions. The use of the information provided is solely at your own risk.
▣ Welcome to the home of charting big: TradingView
Benefit from a ton of financial analysis features, instruments and data. Have a look around, and if you do choose to go with an upgraded plan, you'll get up to $30.
Discover it here - affiliate link -

TRX/BTC Main Trend. Linear 1 week. Rhombus 250% The main trend. Breakout. Linear chart 1 week, to show the trend more clearly without market noise. Rhombus (diamond) 250%. Breakdown of the price and fixation above the resistance of the main trend (downtrend channel), as well as the aggregate of the diamond resistance edge.
Remember, 5 05 2022 starts USDD possible prepared "stream of positive news" to accompany this reversal of the trend.
This is what the main trend (long-term) looks like on the candlestick chart on the same 1 week timeframe
Secondary trend. Rhombus zone (reversal pattern) on 3 day timeframe
Local trend. This trading situation breakdown and exit from the local accumulation channel.

$TRX/#BTC [#TRON]: Resistance_Breakout_ConfirmationWe've detected a Resistance Breakout and Confirmation on the $TRX / $BTC chart. The price has broken above a key resistance level and has been confirmed by a strong candle, indicating a potential bullish trend. The next resistance key levels are at 0.00000309 | 0.00000325 | 0.00000358 and the major support zones are respectively at 0.00000276 | 0.00000259 | 0.00000226. We may consider entering a trade at the current price zone at 0.00000304 and targetting higher levels.
Technical Metrics :
Current price: 0.00000304
24H Volume: 128.1084 Ƀ
24H Price change: 3.401%
- Pivot Points - Levels :
Resistance: 0.00000309 | 0.00000325 | 0.00000358
Support: 0.00000276 | 0.00000259 | 0.00000226
Indicators recommandation :
Oscillators: SELL
Moving Averages: STRONG_BUY
Technical Indicators Summary : BUY
- In-depth TRXBTC technical analysis on > Tradingview TA page
What do you think of this analysis? Share your insights and let's discuss in the comments below. Your like, follow and support would be greatly appreciated!
Welcome to the home of charting big: TradingView
Benefit from a ton of financial analysis features, instruments and data. Have a look around, and if you do choose to go with an upgraded plan, you'll get up to $30.
Discover it here

$TRX/#BTC [#TRON]: Resistance_BreakoutHey traders, we've identified a Resistance Breakout on the $TRX / $BTC chart. The price has broken above a key resistance level, which can indicate a potential bullish trend. Taking in consideration the next resistance key levels are at 0.00000286 | 0.00000293 | 0.00000311 and the major support zones are respectively at 0.00000268 | 0.00000257 | 0.00000239. It is a bullish indication and we may consider entering at the current price zone at 0.0000029 and targetting higher levels.
Technical Metrics :
Current price: 0.0000029
24H Volume: 101.4721 Ƀ
24H Price change: 1.045%
- Pivot Points - Levels :
Resistance: 0.00000286 | 0.00000293 | 0.00000311
Support: 0.00000268 | 0.00000257 | 0.00000239
Indicators recommandation :
Oscillators: NEUTRAL
Moving Averages: STRONG_BUY
Technical Indicators Summary : BUY
- In-depth TRXBTC technical analysis on > Tradingview TA page
What do you think of this analysis? Share your insights and let's discuss in the comments below. Your like, follow and support would be greatly appreciated!
Welcome to the home of charting big: TradingView
Benefit from a ton of financial analysis features, instruments and data. Have a look around, and if you do choose to go with an upgraded plan, you'll get up to $30.
Discover it here
