TRXBTC trade ideas

Trx longThink this has plenty of room to move up. Still heavy on the TRX, let’s see how this plays out.
Not financial advice

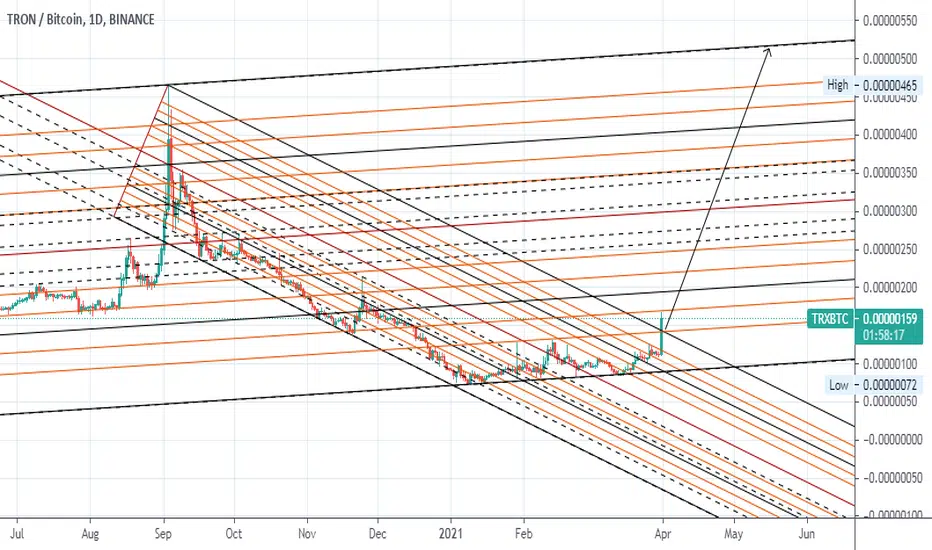
TRX vs BTC | Trend now BEGIN | Long Run for TRONTRXBTC has started to grow and are trying to start a massive up move.
There are a massive volume of buying in past days,
The Stoch are in oversold and headed up.
FEB for ALTs, BTC currently are in sideways thesis, You can see many ALTs are now performing a massive move.
BUY:
00000090-1000
Targets are mentioned in the chart above.
Thank you.

TRX Still Got Room for Bulls (TRX/BTC)Chart is clear. We can expect TRX to grow more. Just don't forget that this is weekly.
I'm just a trader like u guys, and I just wanted to share what I saw here. Don't take it as a financial advise.

TRX First, Easy profits TRX is one of the coins that didn't start its bullrun yet
Everything seems good
im expecting a huge return from this coin in the long term
Good luck

TRX slowly going up...very nice buy setup, longer termYOUR LIKE OR COMMENT IS MY FUEL FOR NEXT ANALYSIS :) IF U HAVE ANY QUESTION REACH ME HERE
This is not a financial advice. Always do your own research and always put stoploss in your trade (SL) :) If you want more detailed info how to study and read charts or just need help with some coin, just write to me here a comment, i will try to answer to everybody... i can help you :) all for free, don't worry, BE HAPPY!


TRX TRX pumping. Do not recommend to buy above ~128. May even catch it at ~120. But the overall tendency is very bullish. Has a lot of space to grow to.

TRX For short and long term TRX just Broke the major resistance at 133 Sat now we will see better TRX movement @CryptoObattal


Crypto|TRX/BTC|LongLong TRX/BTC
Activation of the transaction only when the blue zone is fixed/broken.
The author recommends the use of anchoring fixed the blue zone, this variation is less risky.
If there is increased volatility in the market and the price is held for more than 2-3 minutes behind the activation zone after the breakdown, then the activation of the idea occurs at the prices behind the activation zone.
The idea is to work out the resistance level .
* Possible closing of a trade before reaching the take/stop zone. The author can close the deal for subjective reasons, this does not completely cancel the idea and is not a call to the same action, you can continue working out the idea according to your data, but without the support of the author.
+ Maybe right now we will go even lower, then it's okay, the idea is not activated and simply canceled.
+ ! - zone highlighted by the ellipse is a zone of increased resistance, in this area there is a possible reversal for a correction, please take this factor into account in this transaction.
The "forecast" tool is used for more noticeable display of % (for the place of the usual % scale) of the price change, I do not put the date and time of the transaction, only %.
Blue zones - activation zones.
Green zones - take zones.
The red zone - stop zone.
Working out the stop when the price returns to the level after activation + fixing in the red zone.
Orange arrow - the direction of take.
Black arrow - neutral scenario without activating the trade.
The red arrow - the direction of the stop.
SUM PNL: This parameter displays the total % of all closed ideas of the "new" format (according to the author) for this sector at the time of publication of the idea. The calculation is very "clumsy" just the sum of the profits of all the ideas, based on this indicator, you can more accurately assess the risks when working with my ideas of this sector. I present you the construction of the idea, you can use it yourself as you like based on your subjective view and risks, the calculation of the PNL indicator is carried out only on transactions that the author closed on TV in manual mode or by take.
P.S Please use RM (risk management) and MM (money management) if you decide to use my ideas, there will always be unprofitable ideas, this will definitely happen, the goal of the system is that there will be more profitable ideas at a distance.


TRX/BTC Inverse Head and Shoulders accumulation patternTRX is a massive inverse head and shoulders structures that is ~1000days at the moment, measured move is ~678% move.

Trx bombing is comingtrx is susceptible to crazy pump, trx react positively on a valid weekly support , good volume injected, under weekly KOMO wormhole which may absorb the price and oscillators are rising, in 3 weeks from now I expect a big move on this shitcoin,

TRX/BTC READY WITH 300% PUMP POTENTIALTRX/BTC
Current Price = 0.00000114
Pump Potential = 300%
Tenure = 30 to 90 Days
Techinal Analysis
1. Breaks Huge Falling Wedge
2. Ready for Pump by making Higher lows
3. Golden Cross(50EMA Cross over 200EMA at 4H chart)
4. Trading above 200EMA at 4h Chart
5. Trading above 50 at RSI

Optimal Time Frame for BTC TRX Break OutIchimoku Cloud showing perfect opening for breakout window witb 3-4 Weeks to capitalize. Might touch support one more time before moving back up depending on BTC movements. We'll see how this one plays out. Ultimate gains or Ultimate fail. If it picks up the momentum, buckle up...

Tron to the moon?We broke above the cloud on the daily!
With DeFi coming to Tron ecosystem, billions locked, is it time to finally turn the tables on the previously discredited Tron?

TRXBTC Weeklytron/btc chart.
targets in orange, if fail to hold yellow range then next area in cyan.
There is more sun in the summer.


downward converging trend line in TRX/BTC RSIRSI is forming a downward converging trend line in TRX/BTC 4H chart it could be lead to a bearish or bullish trend.
downward converging trend lines tend to break o the upside more than the downside.
we can trade this after break out to the upside or downside.

💡Don't miss the great buy opportunity in TRXBTCTrading suggestion:
". There is a possibility of temporary retracement to suggested support line (100).
. if so, traders can set orders based on Price Action and expect to reach short-term targets."
Technical analysis:
. TRXBTC is in a range bound and the beginning of uptrend is expected.
. The price is above the 21-Day WEMA which acts as a dynamic support.
. The RSI is at 71.
Take Profits:
TP1= @ 140
TP2= @ 200
TP3= @ 270
TP4= @ 308
TP5= @ 465
SL= Break below S2
❤️ If you find this helpful and want more FREE forecasts in TradingView
. . . . . Please show your support back,
. . . . . . . . Hit the 👍 LIKE button,
. . . . . . . . . . Drop some feedback below in the comment!
❤️ Your Support is very much 🙏 appreciated!❤️
💎 Want us to help you become a better Forex trader?
Now, It's your turn!
Be sure to leave a comment let us know how you see this opportunity and forecast.
Trade well, ❤️
ForecastCity English Support Team ❤️

TRXBTC started #TRXBTC started
#TRX
this are 3 easy target for tron We have bullish action in tron.
profit is ready for trxbtc and trxusdt
