MASSIVE WEEKLY BULLISH DIVERGENCEKeep holding. 160 sats minimum.
Lower low but massive increase in volume.
TRXBTC trade ideas


TRX is about to break outTRX is forming a bottom and wants to break out of this major resistance. The price will skyrocket if this happens. The first target is a major resistance, but the price could go much higher.


TRON against BTC 2021another chart TRX against BTC
Rank #20
Coin
TRON Price (TRX)
$0.03116
5.04%
0.0000008562 BTC
0.00002518 ETH


TRX opportunity to longit left the downside pennant, im curious where it can go. (not a financial advice) GL !

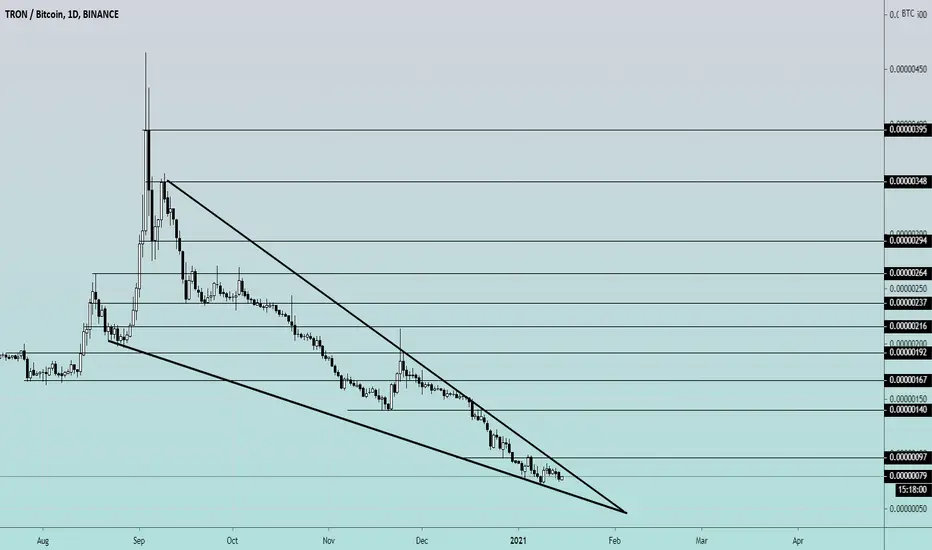
#TRX Pennant pattern, Breakout Will be Huge Long term TradeTRX forming pennant pattern in BTC pair. This is a Mid-term trade and after the breakout, we see a good rally in TRX. IOST has the same pattern and we all see how it skyrockets. TRX will do the same. 100 is the major resistance zone and we see some profit-taking there. This is a mid-term trade and all targets can be achieved. Don't miss this one.
Buy Zone: 77-79 (Add more in Dips)
Target: 88-97-109-125-140-160-175-196-216-235-260-295-345-395
Safest time to buy trxHello guys, there is bullish divergence on chart, last time it happened trx went to 60% up, right now target is 135 sat, trx has also touched the price of first time it got listed on binance at 72 sat.
stop loss: 71 sat

Tron on major downslideHey guys , as you can see that one is a very massive head and shoulder signal and tron has already started dumping, it is probably gonna go more down from here on, just stay away from this, targets are given on chart.
1st 204
2nd 143

trade ideathe bottom looks like its in, just like the others altcoins how pumped last days, its time for justin's sun shitcoin to move and made us some profits


Crypto|TRX/BTC|LongLong TRX/BTC
Activation of the transaction only when the blue zone is fixed/broken.
The idea is to work out the local resistance level of the triangle.
The "forecast" tool is used for more noticeable display of % (for the place of the usual % scale) of the price change, I do not put the date and time of the transaction, only %.
Blue zones - activation zones.
Green zones - take zones.
The red zone - the stop zone.
Working out the stop when the price returns to the level after activation + fixing in the red zone.
Orange arrow - the direction of take.
Blue arrow - neutral scenario without activating the trade.
The red arrow - the direction of the stop.


TRX/BTC breaks falling wedge + Cup & Handle! TRX/BTC has now broke out of falling wedge resistance. We have also closed above 20EMA(red) giving us more bullish possibilities.
4H candle must close 50EMA (orange) to show even stronger bullish trend.
67 Santosh's mark critical support from 2017!


