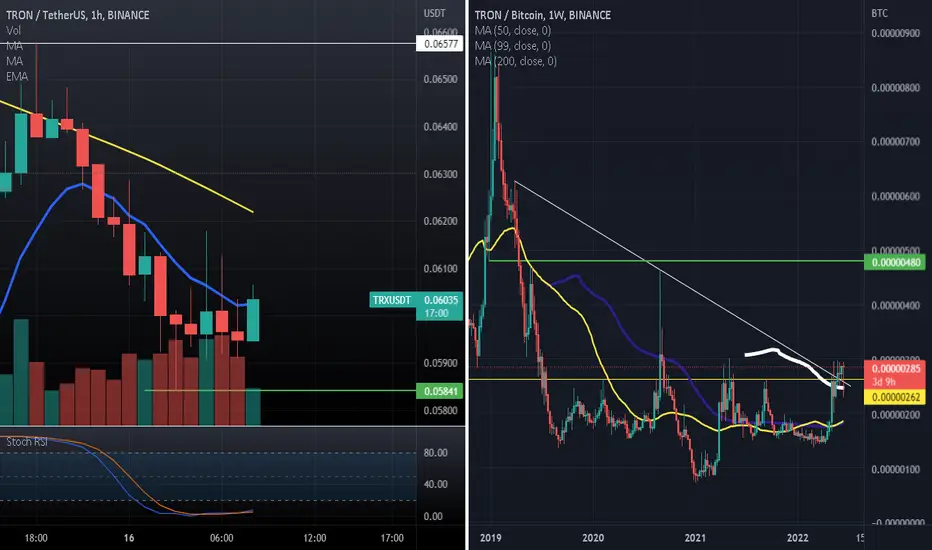
✳️ TRON On A Long-Term Path Towards 700 SatoshisTRON is aiming at 700 satoshis (0.00000700) and since January 2021 we have higher highs and higher lows.
Recently, after a new resistance level was conquered in June 2022, we are seeing bullish consolidation for the past six months.
Trading within a bull-flag, we can expect higher prices in the months to come.
This is a long-term analysis.
Namaste.
TRXBTC trade ideas

TRON/BTC Ready for Another 60% Down Move..?#TRX/BTC Technical Analysis:-
#Tron currently trading at 314 Satoshi area and 360 Satoshi is Strong Resistance Zone.
I think it will Not break in this Cycle.
I am Also Brarish in #Tron/BTC Pair and Expecting another 60-70% Down Move from This Level.
Sell Point :- 320-360 Satoshi
Targets:-
TP1:- 250 Satoshi
TP2:- 180 Satoshi
TP3:- 140 Satoshi
Always Try to Buy Partially and Never buy in One Lot.
Please Like and Appreciate.
Thank you.

TRON - swing trade opportunityOn the above 2-day chart price action has increased over 100% since the buy signal. There is now evidence pointing towards a 50% correction.
1) A ’great sell’ signal prints
2) Regular bearish divergence. Look left.
Generally I’m bullish on Tron however there will be swing trades alone the way and I believe this is one of them.
Good luck!
Ww

TRX/BTC buy signalTron remains strong against Bitcoin . The recent break above the triangle should result in further buying pressure.

TRX/BTC Local Work. Wedge. Rollback. Recruitment zone 2019-2020Notice how the wedge formed above the main trend line. The resistance of the wedge has been broken. The pullback.
The price is 2 months in a sideways pattern in 25% steps. Intraday volatility in this pair is minimal.
The gray area is this support zone of the channel of the main set of 2019 - 2020 position. This is clearly visible on the line chart on the weekly timeframe.
TRX / BTC Main trend. Linear graph. Trend reversal zones

Tron overvaluedHello, tron is one of the few coins which are still up in btc terms and i think if btc breaks down soon it should be one of the worst performers.
TRX is trading still relatively high (compared to other alts) because of the USDD (Luna/UST copy) mechanism which burns Tron.
And we all know how that went.
Im short with a small ammount on Trx as i think it will go down most % from here in comparison to other alts.
Generaly i believe we will see 10-14k Btc/Usd (or worse) in this bearmarket.
Do your own research and only invest money you can afford to loose in crypto.

Tron TRXBTC - HUGE Breakout! Channel + 200MA + Elliott Wave!- Tron is currently one of the strongest altcoin on the crypto market!
- On the weekly chart we can spot a descending channel , that has been destroyed by the bulls.
- Also we can see a broken ymmetrical triangle, which is definitely a great sign too!
- 200 weekly MA is considered as a massive support by huge institutions and the price is currently above the level!
- We are currently in the Impulse Wave (1-2-3-4-5), so it is the best time to buy right now.
- Next resistance is the previous all time high from 2018.
- Look at my ideas about another interesting altcoins in the related section down below ↓
- For more ideas please hit "Like" & "Follow"!

$TRX- all eyes on me update on earlier trx chart
still going strong
wouldn't be surprised with Justin making some bid's to counter Sam's for all the fire sale's going on ..
for now waiting for fomo to kick in and short .09
expecting a fast n furious rally for corn till $26700 before furtheE
eth merge maybe the catalyst

trx/btc- trx broke the line of years resistance.BINANCE:TRXBTC
trx broke a line of 4 years and the pump is underway. great news for bagholders.

Quickpost: Comparing Inverse head & shoulders on TRXBTC & ETHBCPretty simple idea. TRXBTC on the left is in a developing inverse head and shoulders and price action recently tested the 200 week as support and is now primed to begin to move to target. My trade is going to be on TRXUSD.
The chart has the key details and it is pretty simple and fundamental. My main thing still is leaving my damn trades alone enough. I have entered a small position on TRXUSD but once I see it get above its current resistance I will begin adding to it pretty aggressively in the early stages of the move. Once we get above that resistance I will have a 23 risk reward ratio and I will be putting on some margin.

is this tron show time? 🐱🏍Tron has broken a long-term trend in its daily chart and has a pullback to it. Late and at an inopportune time, but it may eventually grow well over Bitcoin.
I hope you find this analysis useful🌹
Follow for more...
#DYOR
TRX Address:
TYny811QZccdS1pvV5nsZJnLdWdbuX1yUE

$TRX HRH Justin Loading ScamPump2.0 the btc pair looks really killer with a breakout of a 3 year range.
was tempted to long this since it gave me Shiba breakout vibes not in this trade just an unbiased opinion .
USDT pair its mid range and fun begins after range is taken out.
Dominance reaching a support level so possible corn pumps taking all the usd pairs up
IMO Justin made a killing during the 2017 run and managed to hold on to his gains

$TRX > $BTC (MEGA BULL)Free bitcoins. Tell your friends. Not financial advice. #TheCryptocracy @dropaganda


TRX/BTC (1D)A cup pattern can be seen for this currency. correction of this currency can from a cup handle . to correct this currency, I marked the price range and targets on the chart.

TRXBTC - Start For 3/8X
TRXBTC :
Break is confirm
BUT :
Price needs to hold this area!
maybe we have a fake break
you can buy now and put your stop loss (if the price closes under the area you can leave from this trade )
or wait for the pullback and then buy it...
note : market is very high risk on buyer position. please consider this and do money management.

TRX - more bullish evidence !I have never been a great believer in this project ! Perhaps because of ignorance ...
What I do know is that TRX has been in a bear market against Bitcoin and is about to break out from a monster symmetrical triangle !!!
The implications of this would be huge ! Not only for Tron but also Bitcoin and the digital asset space as a whole !
That is why I stubbornely refuse to give in to the bearish narrative around crypto currencies !
Numerous projects have a bullish setup and are about to break out agains bitcoin after having been in a bear market for years !!!
Please prove me wrong !!

TRX / BTCOn May 5, Tron DAO launched an algorithmic USDD Stablecoin. Anyone who locks TRX to release USDD stablcoin in 2 months will be liquidated.
I already had a similar prediction published, but the wave was stretched I didn't understand what such manipulation would be for. Now all puzzles are in the picture. It will be the same as usual, everyone will say that Bitcoin is to blame.

TRX/BTC Breakout!!!Looks like TRX/BTC pair is trying to break out of this trendline that started at the ATH in January 2018. But since we are in a bear market, if BTC decides to dump all technical analysis goes through the window and Tron will probably follow it (as happens a lot these days). Set your stop loss.
Good luck!
Not financial advice.

TrxbtcHi . For the last time TRX was in correction and now it's so bullish. Breakup done and TRX has big potential to grow.

TRX / BTC Main trend. Linear graph. Trend reversal zonesI specially made a line chart in order to more clearly show the long-term trend itself without the "market noise" that a candlestick chart gives. The idea is to understand where the price is now locally and where the trend is, as well as to visualize the potential for price growth in case of a breakout of the main trend line (red).
As you can see, the price is now trapped in accumulation with a 44% step. The secondary trend line is already broken and behind. As soon as the price overcomes the zone of the main trend line, there will be a "burst of price growth". While there is an opportunity, accumulate this cryptocurrency.
Also, you should pay attention to the effectiveness of the use of this blockchain now, the speed and cheapness of transactions.

potential head and and shoulder patternpotential head and and shoulder pattern. please do not forget risk management.
