TRX-BTC cup maybeGreetings,
TRX has broken through the level of 190, when the daily chart closes above this level I will take a long position. I think that they will definitely take off the stops to avoid taking extra passengers on this train. Maybe we wanted to draw a bowl with a pen? What do you think? But the depth of the bowl coincides with the next resistance level at 240.
I don't encourage you to buy in my wake, do your own analysis and make your own decision.
Support me with your likes if it's helpful.
I'm also reminded that I have a telegram channel where I post trade ideas more often.
TRXBTC trade ideas

Bitcoin + 5 Cryptocurrencies Analisis Hello traders,
In this video we eu analise the bitcoin and more 6 cryptocurrencies that are interesting for swingtrade.
Please push like button and follow us on tradingview.


Finally we have arrived to the 5th wave of 5th wave on CLFG....... i would never short the final wave. Im ok to take a 50 percent beat right now if need be just so I dont have to fight for the bottom

Appears to just be backtesting the breakout line.... neutral Maybe we wont get down to my target.... kinda waiting for the double test of the line which should be the event we want to long

UPDATE INDEX INDEX ONT ZIL TRX XLM MTL CMTONT 20%
ZIL 20%
TRX 15%
XLM 15%
MTL 15%
CMT 15%
update for the first and 2nd targets, time duration aprox. 1-3 weeks
please check previous stage
original entry was 1933
maintaining targets
3000
6000
10000
15000
20000
no trading advice


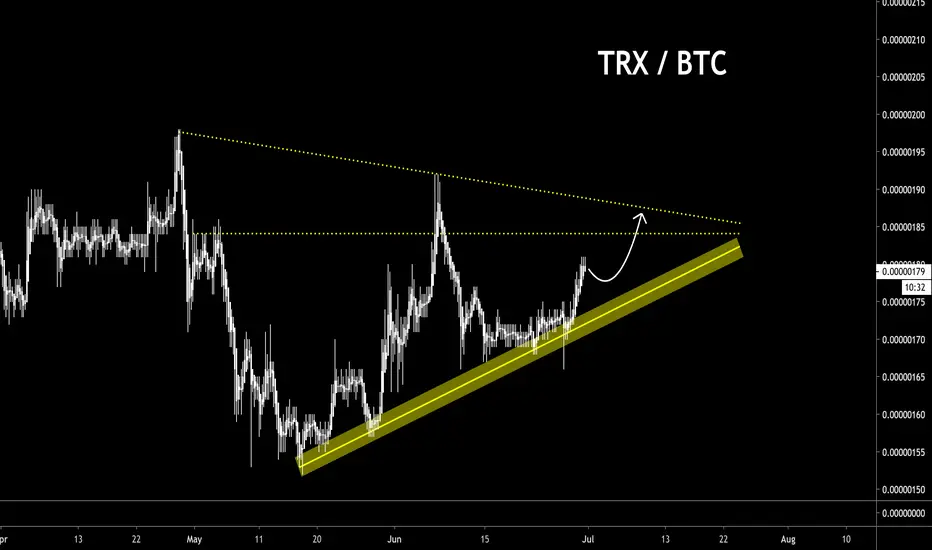
TRX sideways or bullish? What is your opnion? Hello, Traders,
TRX/BTC is inside accumulation box on the daily chart, but the important support levels it seemed that it held the price very well above this level and, now the bulls are trying to take control of this asset, what we can expect for this asset?
Will the price continue in a sideways trend or will it revert to an upward trend? I think it's too early for us to know
To state more accurately the price would have to break the region of 200 satoshis and make a Pull back on the support, in that case, the upward trend would be quite clear in my opinion.
Push the like button and follow us on tradingview.

TRX/BTCHope you all folk have a great day this is another opportunity just for learning purposes ;) Lets see what happens

TRX/BTC - LONG - POTENTIALPAIR: TRX/ BTC
T/F: 1HR
LENGTH: MEDIUM/LONG
ENTRY: 184
TP1: 187
TP2: 192
TP3: 198
TP4: 205
TP5: 215
TP6: 227
TP: 239
S/L: 177
NOTES:
- Sitting on support
- Oversold
- Breakout to pullback
- Strong Uptrend
- TRON 4.0 will launch on 7th July 2020
Look after your portfolio and it will look after you & If you liked this idea, please like and subscribe to my profile.
Please always trade with caution, manage your trades and stop-losses This is not professional financial advice, just my thoughts and trades I am taking please trade safely and responsibly.


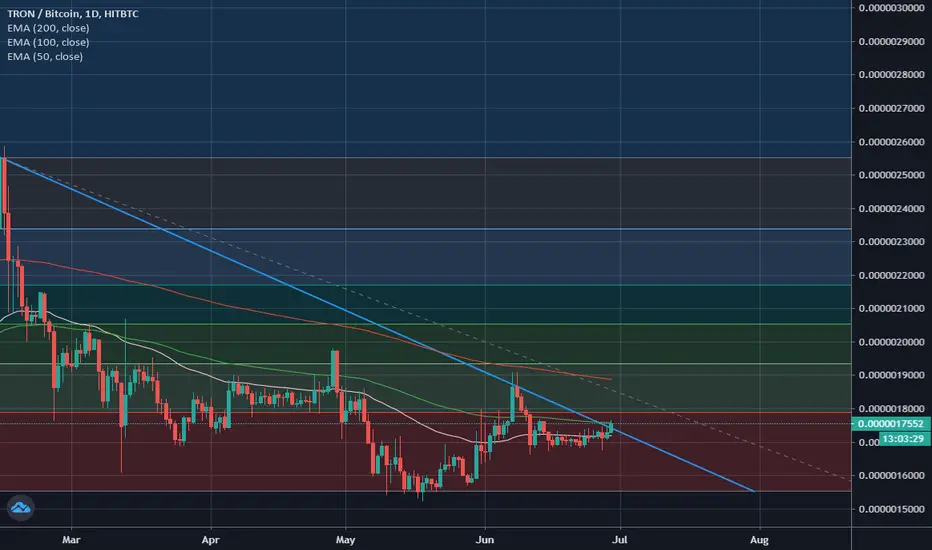
Bullish TRON (TRX)? Next Easy Target MappedWe've seen so many altcoins produce great bullish action... But what about TRON (TRXBTC)?
Here we have multiple signals that are now pointing to growth... Let's have a quick look at those:
We have prices trading above EMA10 and EMA50.
Switching the potential from bearish to bullish.
We have low volume while breaking resistance, supporting the bullish trend.
The MACD is above zero and showing a bullish cross.
The RSI is considered strong/bullish above 50. For TRXBTC on the daily timeframe, the RSI is now at 60+.
Looking at these signals, we can say that TRXBTC can easily jump.
Remember to have a plan if you decide to trade.
The charts are always changing and this one here can also change.
If prices break and close below EMA10, the above analysis becomes invalid and a new one is needed to better know what will happen next.
Thanks a lot for reading.
Namaste.

TRX / BTC — Possible reversal zone for TRONTron is in the range from 250 down to 150 for past year, looks like it can have massive breakout in Q3-Q4 2020. Let's hope for best. On chart mid-term idea. Keep it safe.

Como failure by price upMaximum sales area failure (30) by RSI and above
Failure of the signal line by the MACD line upwards
100 failures by CCI and above
Fundamental News

TRXBTCTron is moving as expected and as I explained to you guys! 182 is almost done, and still looking bullish until 185 - 187. EMA200 is a strong resistance if it's broken, target will be around 220 - 230 but will cross 200/210 if the resistance is broken. keep an eye.

Cup pattern and 10% profit for the lovely Tron!Technical analysis in simple language
Telegram channel "Wise Owl Trader
As you can see in the chart, the cup pattern is being completed. We have a 10% growth potential.

TRXBTC - Broken the trend line.If 1D Close above the trend line and the EMA100 confirms the target guys.. 182 - 185 is not so far.
Cheers!
TRXBTC - Short term signal.TRXBTC - Tron has successfully crossed EMA50(0.0000017179) yesterday but it is facing a hard resistance right now which is the trend line and EMA100 both at 0.0000017598 (Daily candle MUST close above). If its broken move the Stop-loss to 176 or something. There are more chances that it reaches at-least 182 easily.


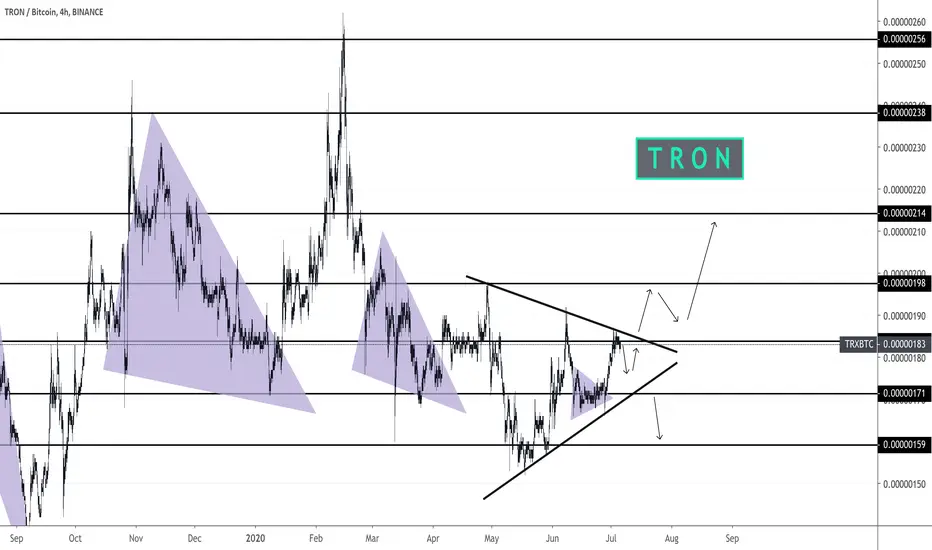
TRX/BTC (Consolidating on 4H)TRX/BTC
-there is a clear local resistance at 175
-if we can break/close above this level
-it will be a good buy signal
-the upside target is the recent top at 192
-stoploss is placed under 168

TRON is ready to prime! @170 should be easy satoshi gainI am seeing very nice set up for easy snatch of Tron and get some easy BTC via tron.
K lets, see double bottom. price been holding strong at 170, push should be here pretty strong.
Entry at 170, looking for a quick 30-50% gains. Super tight SL here.
Remember guys YOU can;t have alt season without TRON!
**LEGENDS**
BLUE = Bear/Resistance :: Yellow = Bull/ Support
Vertical Lines: Fractal dates are moments of interest, where price and time collide to create oscillation.
~Explore the chart for possible scenarios of price actions - use zoom and scroll for better view.~
If you want your coin to be analyzed, JUST ask.
I am Ajion, and i bit you a good HODL, my fellow, CryptoPunks!
