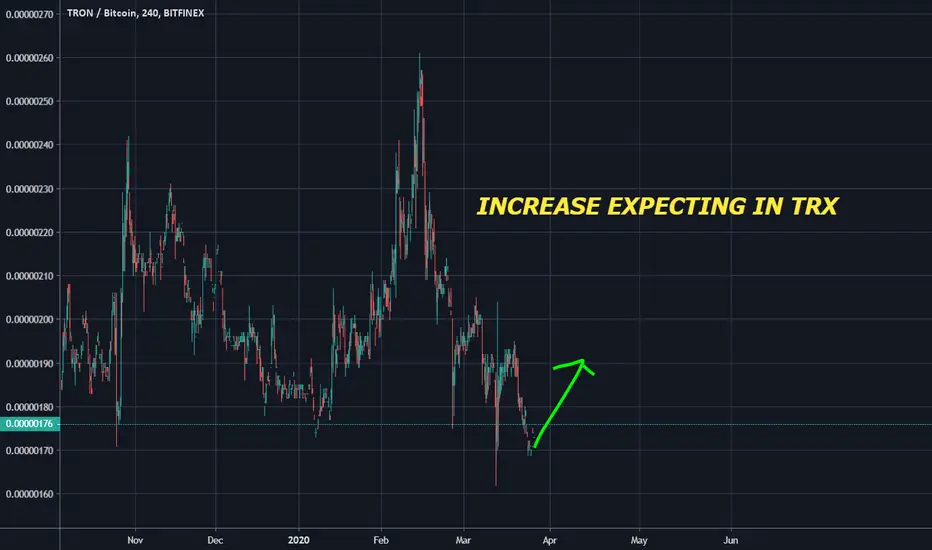
$TRX, Nice volume flowing in as there is a potential breakout $TRX
Nice volume flowing in as there is a potential breakout from descending channel
If manages to Flip this level into support(matching EMA50) , I will aim for an entry w/ target at ~215+ sats (15%).
Set alerts~
#TRX
TRXBTC trade ideas

TRON Challenges Local Trendline, Getting Ready To Pop!TRON (TRXBTC) finally moved above EMA10 after a higher low and a confirmed uptrend... What will happen next?
First, let's take a look at the chart signals
Today two major challenges are taking place, the orange downtrend line, and EMA10.
At the time of writing, prices for TRXBTC are now moving above these two levels.
Daily candle closure is needed for bullish signal confirmation.
Back to 'What will happen next?"
TRXBTC can continue growing and face resistance at around 0.00000190 or EMA50.
If prices move below EMA10 with good volume, we can expect the lower purple trendline to be tested.
If this level breaks, we go lower, if it holds prices will bounce.
We are bullish here but trading volume is still needed.
Today is a Saturday/Weekend, so any signals on low volume can easily reverse, so we consider these EARLY SIGNALS... You've been warned.
The MACD is showing a bullish cross and the RSI is also looking good.
We are looking for TRON to start growing next.
Thanks a lot for reading.
Your support is truly appreciated.
Namaste.
P.S. Always have a plan/strategy if you decide to trade.

With all the fear.... crypto will soon bring JOY!!LOVE THIS PROJECT. Signed so many new clients to further crypto usage. High transactions.... LFG

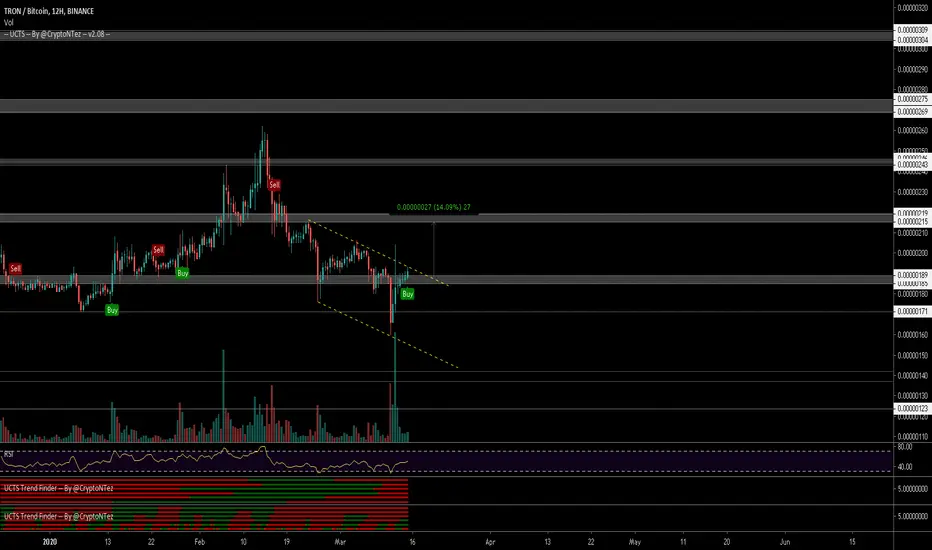
TRX Looking for a breakout?Descending wedge on the day charts forming nicely. On a 4 of 9 in the sell setup. Looking to take some profits at 193sats and 200sats depending if we get a 9 or not. Will have to see how market plays out as the situation in the world is very unpredictable at the moment.

TRX/BTC (Potential Bulls Strength?)TRX/BTC
TRX is gaining strength after the price rallied 10% up but currently facing minor resistance because of the descending trend-line force.
If TRX failed to break this line, we could expect a minor pullback and form its new Higher Low then proceed to new High.
The stop-loss is below the low at 168 sats.

TRX ANALYSIS: DOUBLE BOTTOM INCOMINGTRX ANALYSIS:
TRX is incoming on a double bottom inside the support zone of 160-168 sats. Multiple red hourly candles are forming and it looks to be continuing down into the 160s. TRX is coming close to all time lows as it continues to the selloff, but given the previous support lines, buyers will step in soon. ATR is hitting lows as it inches into the low 5s. RSI pushing oversold and volume diminishing. 3/3 showing a bottom incoming and an expected rally back up to clear T1 at 174, T2 at 180, and T3 at 185 sats. The new resistance zone is now in place after the collapse. Resistance below the 200MA at 188+ is a key level now.
Possible Entires: 160-168 sats

TRON (TRX) ARE ABOUT TO INCREASE TO NEW HIGH LEVELdepens on my trend study, expect TRX INCREASE IN THE NEXT TIME.
This depens on volume and trend data.
# for private signals contact me.

TRX Looks Bullish📡 TRX / BTC
🌐 Exchange : #BINANCE
▶️ Buy : 172
👇 Targets :
✅ Tp 1 : 187 (12%)
✅ Tp 2 : 200 (20%)
✅ Tp 3 : 215 (32%)
🔴 Stop loss Zone : 160 ~ 157

The Horrors of Charting Low Sat Coins [Quick Updates]Hey all, the Trading Guru is back with another entry on a new series called 'Quick Updates'.
Uhhg. I absolutely hate charting really low sat coins. Incredibly thick orderbooks, very difficult to draw lines or do proper technical analysis. Quick question to the community, do you have any tips for charting such coins under say 500 sats? Any tricks I should know of or that you would like to share to others?
The upside of the low sat coins is that every sat increase is incredibly good for your portfolio, as the relative percentage gains per trade are massive. That's why I will attempt a nice long position here on TRXBTC using support and resistance levels.
--- What is The Quick Update Series All About? ---
I am starting a new tag (quickupdates) where I quickly share great opportunities based on TA for shorter timeframes, such as 4h, 1h, and 15m. It will not contain just a short explanation, in order to keep the velocity up and make sure you get to see the opportunities as fast as possible.
Follow me for consistent high quality updates, with clear explanations and charts.
Please like this post to support me.
- Trading Guru
--------------------------------------------------------------
Disclaimer!
This post does not provide financial advice. It is for educational purposes only!
About the links below:
20% Discount on Binance: Did you know that Binance introduced a new system where you can get 20% discount on your fees? Find the step-by-step guide on how to add it to your account on the website of 100eyes
Forex & Crypto Scanner: Nobody can keep track of all the pairs on all timeframes. This scanner works on Telegram and sends an automated message including a chart every time something happens to a coin. E.g. it can automatically detect areas of support and resistance, RSI Divergences, Fib Retracements, and more.


When everybody thinks the BEAST is sleeping..that’s when it goesHigh Compression and high potential, this is BTC 2.0
Not a Financial Advice

TRXBTCTRXBTC
4HR
SHORT/SELL
Entry: 0.00000198
Stop Loss: 0.00000205
Take Profit: 0.00000175
Risk/Reward: 3.29
“Pending”
Support and resistance, fib retracement, CCI, EMA, short position indicator.

TRX ANALYSIS: CRITICAL MAKE OR BREAK TRX ANALYSIS:
TRX is forming a small right shoulder at the moment as it re-tests the 200MA. This is a very critical point for TRX. Make or break, if you will. 200MA has been tested multiple times over and over and I expect it to be broken upon this try to hit T1 at 198 sats, T2 at 204 sats, and lastly T3 at 209 sats. This could be a fake out before another break down, given the volume and ATR decreasing. Therefore, take all profit at the given take profit zones.
Possible Entries: 187-190 sats

TRX/BTC TA Update (key trend-line broken?)TRX/BTC
TRX broke key trendline of support and currently facing rejection with the 50D MA plus trendline becoming a new resistance area.
If TRX finds this big challenge and unable to get above this level in the coming few days.
It is likely we see further downside down to 130 sats and potentially form a double bottom for a reversal trend change.

Making its way across,coiling up...Fueling up for the ride up,keeping a close eye out for the breakout.

$TRX, Trying to break above descending channel...$TRX
Looking tempting here as it tries to break above descending channel...
Volume increasing, UCTS Buy signal flashing on the 12H.
#TRX
TRON Chart Fully Mapped | What Happens Next? | 72% Target MappedTRON (TRXBTC) is now trading within an ascending channel on a newly formed uptrend; higher highs and higher lows... What happens next?
After the last high hit on the 14-Feb., prices for TRXBTC started to drop.
Yesterday a low was hit 0.00000160 which coincices with the 0.786 Fib. retracement support relative to the last bullish wave, which can signal the end of the retrace.
We can also notice really high volume today.
If the bulls continue to garner momentum while pushing prices up, we can expect TRXBTC to reverse and hit this ascending channel TOP...
This will result in 50% of gains or even more.
Remember to have a plan/strategy if you decide to trade this call.
This is not financial advice.
Thanks a lot for your continued support.
Namaste.

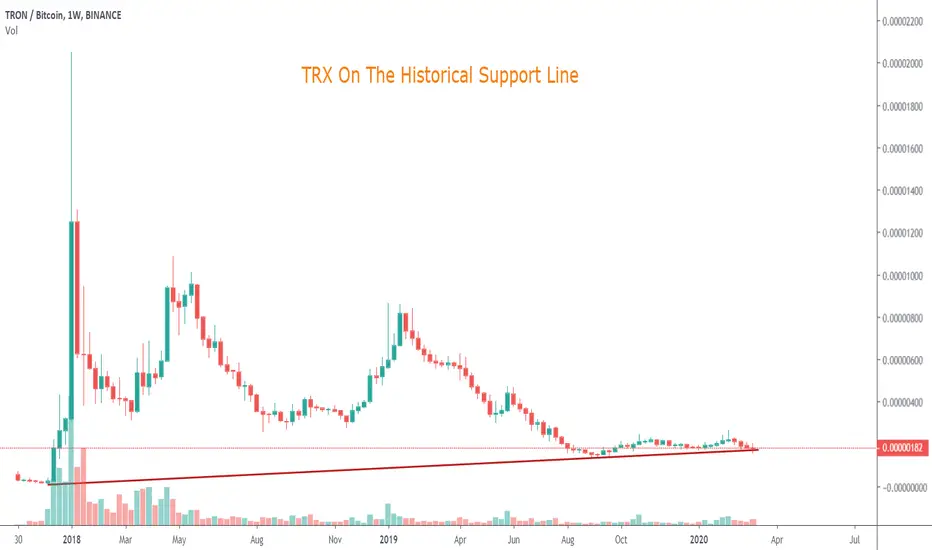
TRX On a Historical Support Line ,Good Position 📡 #TRX / BTC
🌐 Exchange : #BINANCE
▶️ Buy : 182
👇 Targets :
✅ Tp 1 : 196 (8%)
✅ Tp 2 : 211 (16%)
✅ Tp 3 : 231 (27%)
🔴 Stop loss Zone : 160
TRX & Lookalikes Mouthwatering 4 da BULLZThere are countless shitcoin which has the almost same PA
For traders who thinks last PA is a retracement, we are at good refill areas,
If you are bearish overall just continue to short every damn LH,
Trading withour emotions is fuckin priceless...

TRXBTC: Long PositionOn the daily timeframe, it floats near support, the situation is similar to XRPBTC : long here is less risky and looks more reasonable. Stop could be tight.
But need to keep in mind (always) overall market conditions because it could change everything.
Information is just for educational purposes, never financial advice. Always do your own research.


