TRXBTC trade ideas

trx/btc binanace buy signal all things showen in the chart
buy zone 209-210
1st trgt : 222
2nd:248
3rd: 273
4th: 323
stop -190 for mildterm position
stop -177 for long position
like and share for support me
tnxxx ;)

TRX/BTC - so bearish chartTron is in brutal downtrend, no doubt about it. The ABC correction is almost finished and after the correction will be finished, TRX will very likely go to the new 2 years low.

Tron TRX Golden CrossIt doesn't get much more bottomey than this. Double rounded bottoms with a higher low, a Golden Cross on the Daily, and a break of key resistance.
Today is a key day. We are looking for a close above this resistance. However it would not be surprising if this does not wait around.

TRX/BTC Ascending Triangle BreakoutIn this chart we're looking at TRXBTC on the 1D chart as price has consolidated into an ascending triangle. Price is right at the horizontal boundary around 233. A breakout will be confirmed once price prints a 1D candle above the 237 price line.
This ascending triangle has a price target of around 330 for about a 41% gain.
Price has also broken through the EMA200 and has taken hold above it. This adds to the probability of price continuing higher.
If you would like to see more of these ideas on a regular basis, follow me as I will be posting many more exciting chances to earn on chart pattern breakouts this upcoming year!
Like or comment if you found this idea interesting or helpful in any way!
Cheers!

Adam and EveLook at bitcoin dominance, if bitcoin becomes to dominant, this idea is surely invalidated.

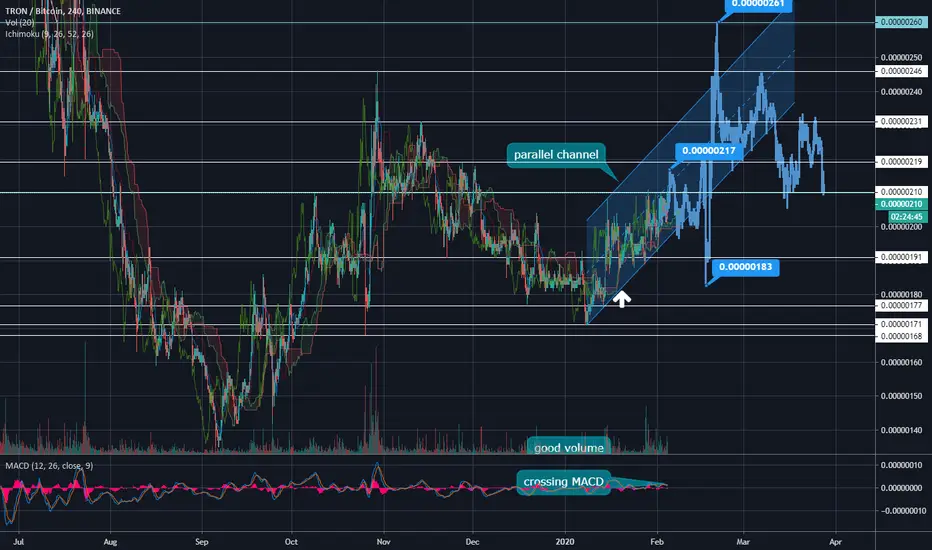
TRX/BTC BINANCE4H Candles
As far as price stays in the parallel uptrend channel,
we have bullish movement
If price breaks up or down the parallal channel,
new analysis is needed
volume rising
MACD bearish going for crossing
3 SUPPORT AREAS
Good Luck

TRX/BTC ready for 300 sats? Welcome fellow Tradingviewers,
The infamous TRX Sh*tcoin, no matter what you think about this coin, when oppurtunity arises you act by it.
Without further or due, lets start analysing:
We will be analysing TRX using a top-down strategy, including candlestick patterns, indicators and price patterns.
Monthly :
- The October monthly close gave the first Buy signal.
- The last monthly close was neutral and this one is starting to look like a bullish engulfing candle, indicating more upside momentum
Weekly :
- The last weekly candle closed in a bullish engulfing candle, indicating more upside.
- The last weekly candle did not manage to close high enough to break the neckline of the Cup & Handle pattern, if this week gets it done, then more upside momentum is expected.
- MACD has crossed bullish, indicating more upside momentum.
- RSI is still neutral.
Daily :
- The last daily candle had a huge wick to the downside, indicating more upside momentum.
- It looks like the Neckline of this possible C & H pattern has been tested with absolute precision and bounced back, indicating more upside.
- MACD is in bullish territory, indicating more upside momentum.
- RSI is in neutral.
- Currently battling the 230-240 sats area
In summary:
We can clearly see that the bulls are trying to let TRX take off but it is not yet confirmed. A daily close above the 230-240 zone would let me believe that the C&H is in play and that we could start to head towards the 280-300 sats area.
This analyses is only intended to share my idea, to educate and entertain you guys.
This should not be considered as financial advice.
I hope you guys enjoyed this analyses, if you did don't forget to leave a Like !
If you want to share your thoughts, please do so in the comments below!
Kind Regards,
FORALLCRYPTO

TRX/BTC BINANCE4H Candles
As far as price stays in the parallel uptrend channel,
we have bullish movement
Bar Pattern repetition expected
MACD is crossing
volume is rising

TRXBTC Bullish movement1H Candles
strong support
As far as price stays in the parallel uptrend channel ,
we have bullish movement
Bar Pattern repetition expected
MACD is crossing
volume is rising

Short term looking good for $TRXBit of an ascending triangle forming short-term,
Swing trade opportunity for a 50% + gain on your BTC stack
Close above 220 - 230 sats and we could see 350 sats quickly
Long term still a downtrend, anything below 850 sats is a lower high

[300% ROI] SEEMS REASONABLE TRONBTCIt broke its long term channel and made first impulse and retraced.
Good place to be a buyer here. It stayed more than 4 months and consolidate.
Maybe 1 or 2 months it CAN go sideways but i need to buy from this areas.
My setup like that:
Buy: 200 sats
Sell: 603 sats
Stop: 130 sats
Trade time: It should resolve in 2020. (Mid-term trade)
R:R (Risk to reward): more than 6
If I can sell trx from 603 sats it means I will gain more than 300% ROI which is reasonable.
If you like this format, trade setups like, share and follow for more. Thank you.
You can check my other mid-long term analyisis on BTC here;

TRX/BTC Bullish flag15 min term chart have bullish flag. Pivot and bollinger look ok. my first target 246 but it ll go high in my opinion.


TRON can pump nicelyTRX - Tron had a falling wedge break out yesterday.
Price is currently testing 200DMA as resistance. Expecting a 20% rise once price break above 200DMA.
TRON can pump nicely in the next few days.
Trade Signal:
Entries: 0.00000185-195
Exit: 0.00000225-240
STOP: 0.00000175

TRX/BTC BINANCE4H Candles
Tron has not pump yet so...
Bar Pattern Repetition expected
volume rising
bullish MACD
3 SUPPORT AREAS
up to 80% profit in 54 days
Good Luck

TRX/BTC 4H CANDLESAs far as price stays in the parallel uptrend channel,
we have bullish movement
Bar Pattern repetition expected
MACD is crossing
volume is rising
If price breaks up or down the parallel channel,
new analysis is needed

TRXBTC now 32% up from Our entry TRXBTC now 231 Satoshi.
And went upto 239 Satoshi.
according to Technical Analysis I told you our entry was 188 Satoshi.
now I am booking some profit.
still chance to TP2 but I will wait for dip.
congrats guys.
Please like and follow me for latest crypto updates.
Thank you

TRX breaks out - up 13% in past 30 minutesTron has just broken out of a giant pennant it has been moving within for the past six months, including a move above the weekly 21 EMA and any other key moving average you care to name. This will be a crucial time now to see if TRX will continue up to join the alt party which has been gathering momentum over the past few days.
Save crucial space on your Trading View chart by utilising the free RSI and StochRSI indicator which overlays both in a clear and helpful fashion. Add the essential EMA/SMA indicator to your chart too.
Please give me a thumbs up and follow me if you found my analysis interesting. This is for educational purposes only and not a recommendation to buy or sell.

TRX / BTC Falling Wedge. Cycle. Work on a coin.TRON after a local maximum formed a local downtrend. This trend has formed a downward wedge .
If this wedge works out on a global scale, a double bottom will form, which will become a reversal pattern of the main trend.
ENTRANCE
1) on the breakthrough of the line of resistance of the wedge . (maybe it’s happening now).
2) on confirmation of support in the region of 130-150 satosh if the price reaches there.
Stop loss
Under key support levels during your entry into the market.
Do not forget to move Stop Loss during the price increase, but take into account the volatility of the coin.
TARGET
On the chart, I showed the first potential movement when trading in a local trend.
To see in the global where the price is, look at these previous training ideas, where this coin was used as an example.
1) TRAINING. Theories of the Dow. Types of trends. Phase TRON. There is still a bit
TRON Lateral movement. Possible formation of a double bottom .

TRX/BTC 28%??RSI = Bullish Divergence and going into a bullish region
200 ma (black line) = Sitting nicely above this
Price Action Vigor = We have a nice tick up on the PAV
Super Guppy is also turning bullish again which could signal a decent move up
Buy and hold

TRX/BTC 16% up and towards Target 1 and Target 2#TRXBTC Chart Update:
Our Entry was 188 Satoshi.
#TRX now 16% from our Entry.
and TRX went upto 218 Satoshi and now trading at 215 Satoshi.
Now Good sign for Candle Close above Trend line.
Towards TP1 & TP2.
Support 1: 210 Satoshi
Support 2: 200 Satoshi
Resistance : 231/274 Sat.
Please like and follow me guys for latest crypto updates.
Thank you
