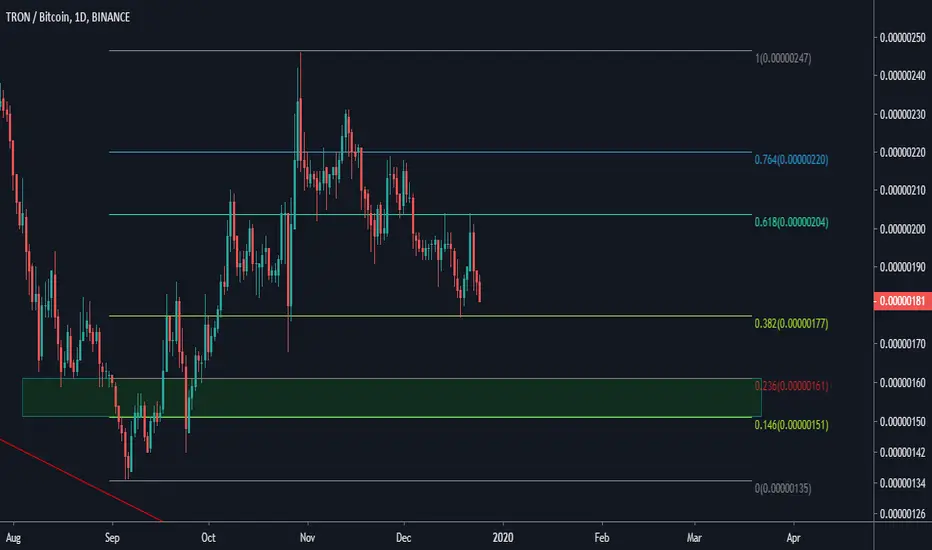
TRON Falling WedgeFalling Wedge setup. A lot of these seem to be forming amongst cryptocurrencies, maybe its just my selection preferences.. Included fibonacci retracement levels.
TRXBTC trade ideas

TRX/BTCTRX holds a critical support area or gold level. The price still respects this downward bullish pattern, which usually breaks up. An early sign of bearish weakness is not able to lower the price

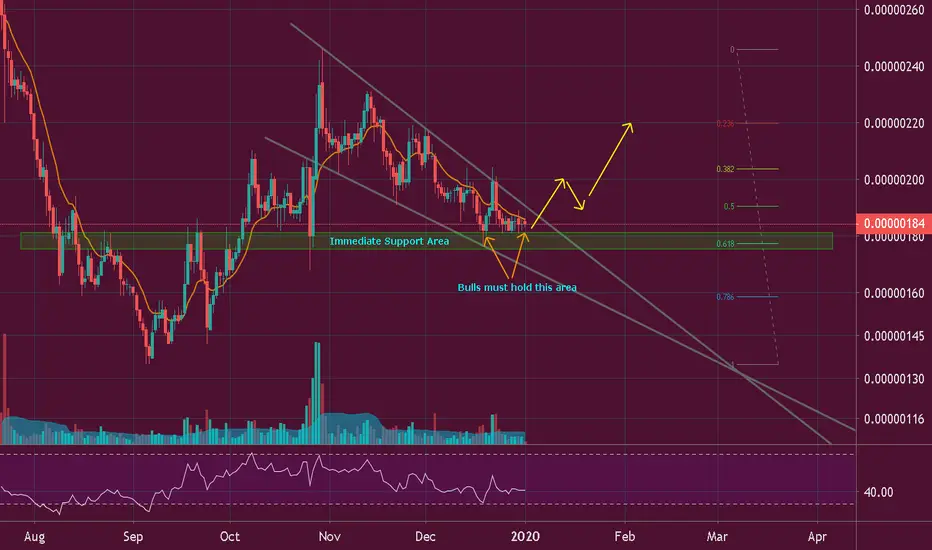
TRX/BTC TA Update (Early Sign of Bulls?)TRX/BTC
TRX is holding a critical support area or the golden Fib level. This key support between 183 - 177 sats are the most level to defend by the Bulls to keep things alive.
The price is still respecting this downward bullish pattern which typically breaks to the upside. An early sign of bear weakness is unable to bring the price to lower
low since the minor pump happened last Dec 22. If you're going to play a Long position, you can place your stop-loss below wick at 175 sats area.

TRX BTC 1D bearish bat is formingPotentially, a bearish bat is forming on the daily TRX / BTC chart.
Leg C should bottom out at around 150 satoshi. Leg D should start in the beginning of February and should bring the price to the area of 400 sat.
Good luck in your trading!

TRON Trade Signal For 200%+ [TRXBTC](200%) @alanmastersHere is a trade signal for TRON (TRXBTC). The chart is now fully ready and it is very likely that we will have a bullish move here... If the trade goes wrong, we have a stop-loss in place.
----
PAIR: (TRON | TRXBTC)
BUY: 0.00000190 - 0.00000220
NEXT SUPPORT: 0.00000165 - 0.00000185
TARGET:
(1) 0.00000245
(2) 0.00000285
(3) 0.00000310
(4) 0.00000355
(5) 0.00000420
(6) 0.00000535
(7) 0.00000600
PROFITS POTENTIAL: 200%
(Buy calculated at 0.00000200)
STOP: Close weekly below 0.00000135.
----
Alan Masters Quick Tips
Make sure to have a plan/strategy before you trade.
Trade at your own risk.
This is not financial advice.
Be grateful.
Accept your mistakes and learn from them.
Read, study, practice, work, consistency, dedication = Positive results.
Wishing you great success, wealth, health, prosperity, security, and profits, now and always...
NAMASTE.

Two-valley pattern and 7 to 17 percent profitAccording to chart information, the pattern of two valleys is being formed. In that case, a 7% profit is likely. If you are a risk taker and enter now, a 17% profit is possible.

3day Tron + scriptB shows signs of life...tron needs to hold the bear retest on the bottom cloud.
scriptB looks like it could show flag a scalp opportunist soon, possibly a relief rally before more lows...
to use these on your screen please visit tradingscripts.best

TRX LONG IDEALooking for two possible bullish scenarios on TRX. Invalidation of the idea would be below 178-177 sats.

Inverted Head and Shoulders TRON BTC 06.2020The inverted head and shoulders pattern is exactly the opposite of the traditional head and shoulders, as it signals that the action will make a high movement. Often, at the end of a downward trend, the inverted head and shoulders is considered a reversal pattern, since the action usually rises after the formation of this pattern.
The projected price movement is made based on the height of the graphic pattern, which is the distance between the price of the top of the head and the neck line.
06.2020
# TRX
#TRXBTC
#TRON

TRXBTC SHORTIt seems that TRX is going down on a falling wedge and every time it touches the yellow limits in the MACD graph it decides to reverse the trend.
maybe it is now the time to fall again to 180 sat and below from 200 and maybe a profitable trade on the bearish market
its not advice so trade on your conclusions my friends

TRON Lateral movement. Possible formation of a double bottom.As we see on the chart, the Descending Wedge was broken and thus began a lateral price movement, which formed a local maximum, which can act as the top of the Double Bottom figure.
Please note that this is a 1 week time frame.
It is worth noting that the Double Bottom is a reversal pattern, if it is confirmed (a break and price fixing above the level of resistance of the pattern), then it can reverse the lateral movement to an uptrend.
As we see from the history of the graph of this coin, this happened before the last pump.
The pivot points (zones) on which the development of price movements depends, I showed on the chart.
If the double bottom pattern is confirmed and an uptrend will develop, then the downtrend of the main trend (yellow line) will become a strong resistance to a possible uptrend.
ENTRANCE and TARGET
Entering the market after confirming the level of support. The observation area showed.
It is also possible to enter the breakout of the resistance of the “Double Bottom” figure or rollback after the breakout if this movement is confirmed. And the uptrend will develop. But then the potential profit is less.
Stop loss
Under key support levels during your entry into the market.
Do not forget to move Stop Loss during the price increase, but take into account the volatility of the coin.

Possible reversalTRX is just hitting a strong resistance. At the same moment, Relative Strength Index and StochRSI are oversold. It is possible the downtrend continues and TRX loses 10 %


What You Waiting For? $TRXWhat you waiting for? Lets $TRX do it, Santa Rally With $BTC. Thanks to justin we wait your Announce to make Crazy Pump.


TRX / BTX 4 hourHey MR TRON, When big action?
* Mr tron need volume and a lot of it!
* MACD moving averages are indicate theres some bullish potential.
* Bullish devergnce on the 4 hour!
* Is currently in a down trend, but tries ad this momenut to break out of it.
* We need to break the red dotted line!
* Some little green candles are coming!

Good Tron upside TRX-BTC 20% Profit
ENGLISH :
Good Tron upside
With Trend Moving Into Triangle, Good Fundamentals News, Announcing Plans, Reaching the Bottom, Predicted Good Growth for Tron's Popular Cryptocurrency.
FARSI :
ba tavajoh be akhbare khoob, kafe gheymat boodan, harkat dar olgooye mosallas, tatilate sale no 2020 ....pish biniye roshde gheymate khoooobi baraye TRON (TRX) daram.

TRON - Perfect FiboPerfect Correction
Perfect bounce from fibo level:
0.618 - 203
0.500 - 190
0.382 - 177
Perfect UpTrend
first fibo 135-186... extended fibo 1.412 = new local high (calculated 207, actual 210)
second fibo 135-210... extended fibo 1.412 = new local high (calculated 241, actual 246)
third fibo 135-246... extended fibo 1.412 = new local high ??? (calculated 292 ???)

TRX/BTC TA Update (Retest Downward Resistance?)TRX/BTC
TRON is on down-trend action inside this falling wedge channel. A reaction pump after TRX hit the golden Fib 0.618 at 178 sats.
The price is about to retest the downward resistance which is located between 190 - 195 sats area. If TRON is unable to break the resistance again,
A potential retest of previous support or a double bottom scenario might play-out in the future.

Your time is up, bear. Bull. let's do this TRXbullish divergence is seen on the green line and gives the result of movement around the red line. this is a very good time.
The RSI stochastic is at the bottom and has shown an increase. although small, but we can conclude there is hope in a definite movement on TRX.
we can be see that TRX managed to penetrate the green cloud and go back down again, but there was no time to be afraid. it was clear FIBB 0 (133 sat) explain we were at the basic level. today we can expect major bulls like ALT coins in the past.
but we must be careful, in front of us there is a red cloud. is the red cloud able to bring TRX back to 133 sat? I don't know for sure. RSI is at 41. anything can happen. but we must prepare under any circumstances. RISK MANAGEMENT.
FIBB guide lines for all traders so that all of you can make decisions based on your respective trading strategies.

Trx-btc
I think I'm going to dive a little with this, they ask for a new minimum, first a break. Good trip
