TRX/btc broke resistanceSo Tron seems to broke resistance , lets see if it go to 240 has good chance for it
TRXBTC trade ideas


TRX continues it bullish movement - aiming for 300satsBounce at trend line. Rsi increasing - StochRSI is turning bullish again. Time to buy. Allready had a mini pump at almost 10% last 4 hours. This coin as you know flyes when it first starts.

Tron
It is supported by 20MA.
If it falls, there is a possibility of touching the upward trend line.
I think there is no answer if we fall from this upward trend line.
Must be supported by an upward trend line.
Prices fell below the uptrend line and below 0.01364.
If it falls, it is expected to go down to touch the 0.01120 point.
Below 0.01364 is the mid to long-term investment area.
Buying is possible when the bullish trend comes out, but be cautious in trading.
When the price rises above the upward trend line and the 0.01364 point, I think it is better to buy.


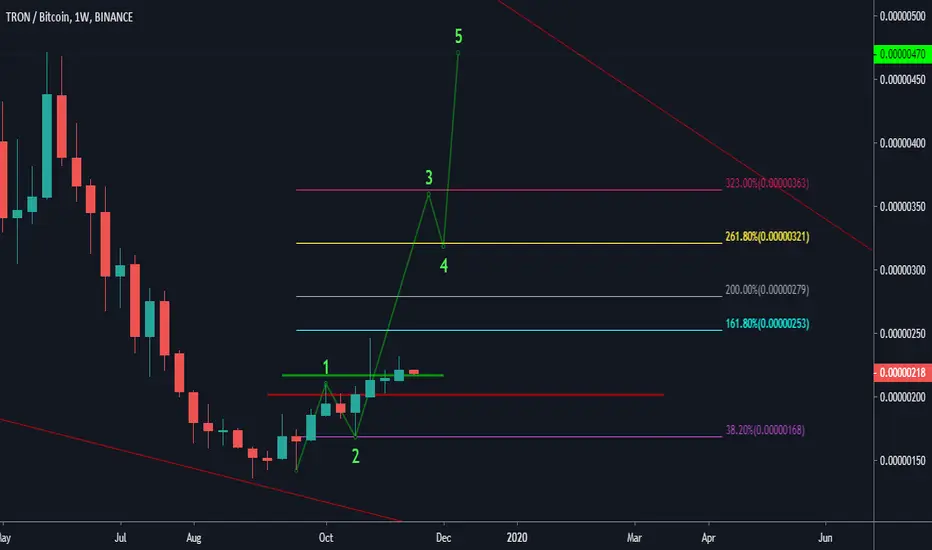
TRXBTC Buy SignalPattern: 1M Falling Wedge.
Signal: Bullish as the price is rebounding after the recent Lower Low. Potential 1D Golden Cross will validate the spike.
Target: 0.00000500 (a Fib retracement level lower (0.500) than the previous one (0.618).

TRX/BTC TA Update TRX/BTC
TRX has been consolidating in this downward channel (Bull Flag). If we can hold 198-186 Sats then there is a high probability continuation to the upside will continue.
An uptrend is still intact provided we don't close below 176 Sats. Trade priority is going Long
Don't forget to click on the thumbs up button
Follow my channel for future Altcoins TA updates
www.tradingview.com
Join Free Trading Community Chat Group
t.me
Trading is simple, don't over complicate things :)

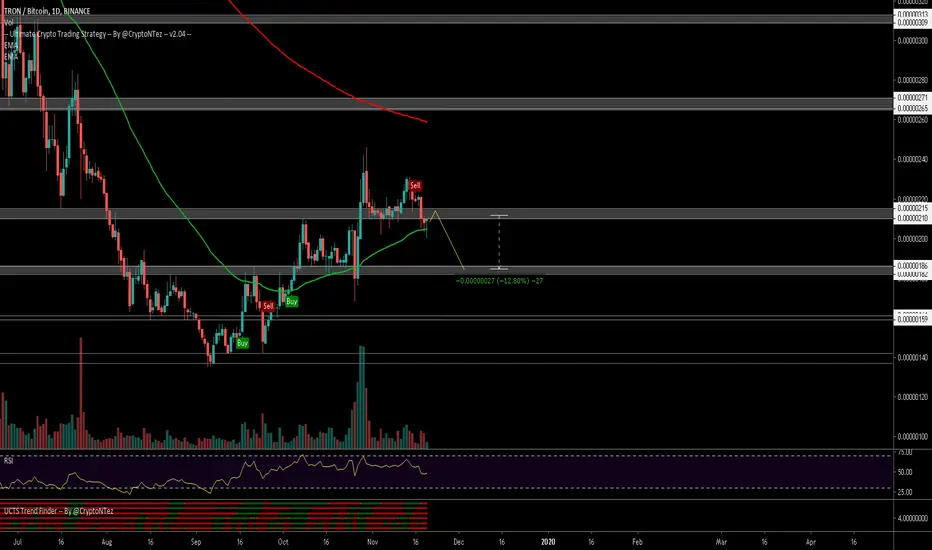
TRON To Resume Its Uptrend? Analysis With Potential ScenariosTRON (TRXBTC) might be done with its retrace, but it is still too early to know for sure.
We can see that TRXBTC is moving within an ascending channel, slowly printing a beautiful uptrend... Prices can go up from here.
Potential scenarios for TRON (TRXBTC)
If 0.00000191 holds and TRXBTC moves higher, it is very likely that it will continue to climb up and reach a new peak. The confirmation is set after a close above EMA100 (0.00000210).
On the other hand, if TRXBTC moves and closes below 0.00000191, it can easily test the lower support levels at 0.00000178 and 0.00000159.
The sentiment is looking bullish overall.
The altcoins vs Bitcoin pairs are starting to grow.
Looking at other altcoins, it is possible that TRON as well will resume its growth.
Namaste.

TRXBTC Bullish channelTRX/BTC is held in a growing channel that almost perfectly respects. It has a correction structure + is located on the lower trendline, from which there was less reflection.
In this case, our Buy Zone is worth 199sats to 194sats. If we can't buy TRX in the buy zone, we don't mind buying it in our Key Zone. Stop Loss goes just below the 189sats channel, because if it breaks it down, it may not get back. Our Take Profit Zones are resistance from historical graph development.


TRON Short termBINANCE:TRXBTC
Hi everyone.
TRX will test 225-230 sat resistance again and then we will have a great dump to the 195 sat and then we will go to new high about 300 sat.

Heikin Ashi Weekly Trend FollowFollow the trend on the weekly Heikin Ashi candles on TRXBTC and you'd have pretty steady and good gains. I ignored the initial post-ICO pump and dump because realistically no one would ever trade an algo in that mess.
Drawdown of 20%, gains of 6x.

TRX/BTC cup and handle in a short term you can see cup and handle i think it will go up in one or two days and this moth chart will go green =>>> for along term trx will go up to 500 at least.

TRX/BTC (Up to 88% Profit Target)TRX/BTC
TRX has been in a healthy uptrend but now consolidating above 50 Day MA and 100 Day MA.
Our uptrend line of support is still in play as Higher Lows support hasn't broken yet.
Bulls are in control as the market structure is still going to the north.
Trade setup
Buy area: 200 Sats - 182 Sats
Sell target: 230 Sats - 340 Sats
Stop loss: 160 Sats
Don't forget to click on the thumbs up button
Follow my channel for future Altcoins TA updates
www.tradingview.com
Join Free Trading Community Chat Group
t.me
Trading is simple, don't over complicate things :)

$TRX, Sell signal on the 1D & lossing support level at ~210sats.$TRX
Sell signal on the 1D chart & lossing support level at ~210 sats..
If it fails to reclaim the level on retest, then the flip should open the window for a short trade on #TRX with target at ~186sats (12%)
#TRX
TRX/BTC - H4Hi, today we are going to talk about TRX
We observe a h4, some important points. The details are highlighted above.
Thank you for reading and leave your comments if you like.
Join the Traders Heaven today, for more exclusive contents!
Link bellow!
Disclaimer: All content of Golden Dragon has only educational and informational purposes, and never should use it as financial advice

TRX has to take a decision hereUpdate from this idea : TRX has failed to stay above the triangle after its breakout, it is still moving upward with the support trendline and forming now a clear triangle. I would expect it to break out to higher levels, but now it is not time to take position anymore. At this point, it is better to enter after a clear movement that determines the future direction.
If you were long from this idea , I recommend you to keep it and move your stop-loss to below the support line.


Today`s ALT!!! TRXBTCBINANCE:TRXBTC
Exchange : Binance
Coin: TRXBTC
Buy Zone: 0.0000022~0.0000021
Target Point: 0.0000023/ 0.00000238/ 0.00000245/ 0.0000026/ 0.00000275
S/L: 0.000002
Risk: HIGH
Term: Middle - Long
You should be careful in buying TRXBTC because of Bitcoin
There are a few tail but it looks like making Rounded Bottom
It`s making Up Trending Line in spite of Bitcoin`s movement
The Volume is slowly down
It needs more time to be pumping !!!
=====================================================================
Today`s ALT is that information is raised regardless of the Coin market situation
So sometimes there`s a high risk trading
Investment is your responsibility.
I'm just providing about coin`s information
=====================================================================


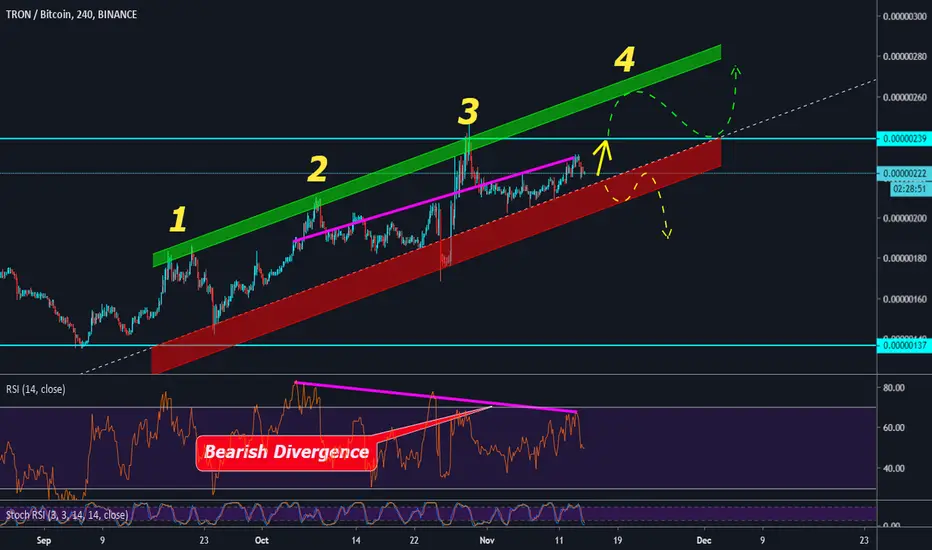
TRON Is Up On An Ascending ChannelTRON Is Up On An Ascending Channel, And May Be Close To Getting Exhausted
RSI has a bearish divergence.
Watch out for STOPS-HUNTING BOTS!!!!
*** Trades should not be placed based upon what you see here! Do your own research and manage your own risk.
Only trade the breakouts to be safe and not be sorry. Wait for confirmation of price direction prior to putting in your trade.
Remember to always, always place your stop loss at the appropriate levels immediately after you have put in your long/short position so as not to get wrecked with your trades.
>>>>> Always be prepared for either scenario of upwards movement, downwards movement, or sometimes even sideways movement (consolidation phase & sometimes even extended consolidation phases). <<<<<
Constructive and positive comments are welcome. Be courteous.
Consider leaving a like after viewing my post, and click on Follow to receive my latest and updated posts.
More Power To All Your Trades,
Ron (The Intrepid Trader)