TRXBTC trade ideas

Really SorryI am so sad to say due to my low experience and BTC dump my signal and analyse failed
i hope you will take your loss soon
TRX on the move?Disclaimer: I am not a professional trader and this is not financial advice, just an idea of what I see. I am currently simply trying to get in the game, learn and only bet very tiny amounts (10$ per trade). I am not a day trader, I'm looking for opportunities on longer time frames ( daily charts ). I also use only very simple indicators like moving averages.
What I see on the chart:
Like my 2 other ideas published today, TRX has formed a very nice cup and handle with a strong short time support at around 210 satoshis. It is after all a pretty simple and easy pattern to see. If that handle confirms its shape, we will likely retest a resistance at around 250 satoshis. It doesn't look to be that hard of a resistance to push through. The more likely hard resistance will be at around 300 satoshis which constituted a historical and strong support for Tron. However, that would still be a 30% increase from its current price.
Second, we've formed consistent higher highs and higher lows from mid-september 2019 showing a good and steady uptrend.
Third, the daily 200 MA (going down) and the daily 50 MA (going up) are on a colliding path which tends to be the sign of a major rally on most assets. The last time (4th of Jan) this meant a 110% gain for TRX when the 2 crossed.
Entry: now or wait for a retest of the 210 support.
Stop-loss: if you enter now, around 200 satoshis.

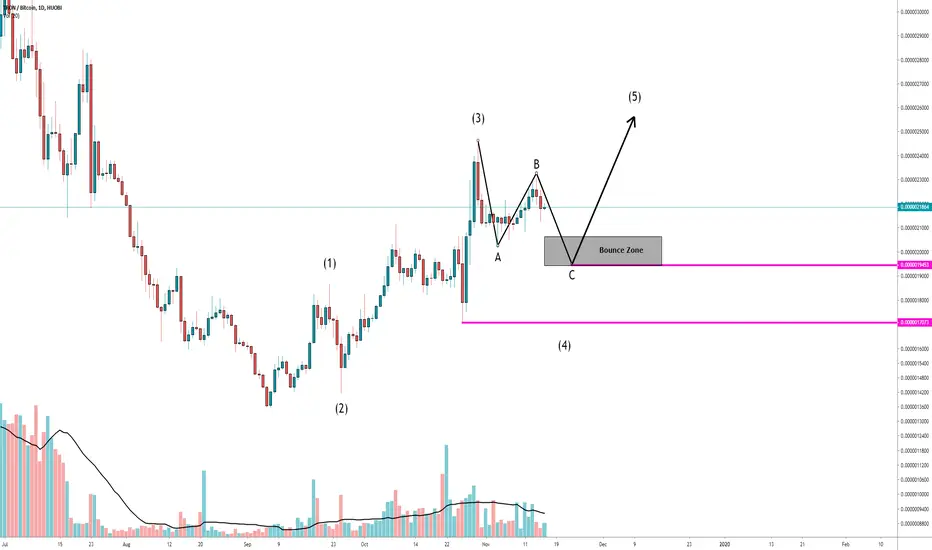
TRXBTC Trend Change| Higher Lows|Key Resistance ! Hello Traders!
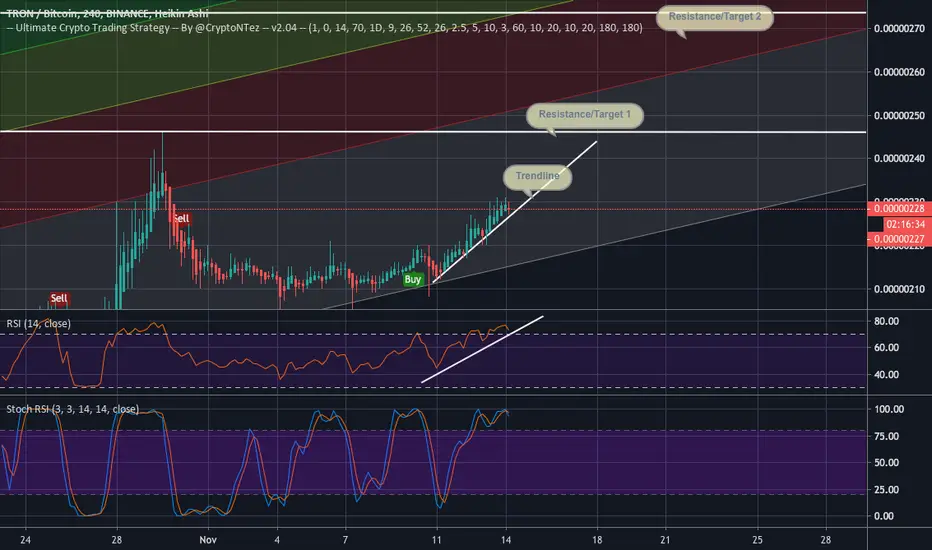
Today’s chart update will be on TRX, 240 timeframe, testing an important resistant level that needs to break to keep the bullish bias. A break from this level will increase the probability of TRX testing structural resistance, which has multiple technical confluences.
Points to consider,
- Confirmed Trend Change
- Support provided by EMA’s
- Key resistance being tested
- Stochastics projected upwards
- RSI trading in upper region
- Healthy Volume
- VPVR cluster showing low volume of transactions
- Structural resistance as next target
TRX has broken its lower low projection and has successfully put in consecutive higher lows as it comes into a key resistance. TRX needs to break this resistance with convincing volume to keep the uptrend intact. Support is currently being provided by the EMA’s which has turned bullish from local lows.
The stochastics is currently trading in the upper region, can stay up here for an extended period of time, however we do have lots of stored momentum to the downside. The RSI on the other hand is respecting its support (red line), bouncing of it multiple times.
Volume is currently healthy, its needs to sustain with bull volume to break resistance, which will also avoid the chances of a false break. The VPVR is showing low volume of transactions from resistance to structural resistance. This signals that this cluster will pose little resistance in terms of volume of transactions, if and when TRX tests.
Structural resistance is the technical target for TRX as this level is in confluence with multiple technical indicators such as the .50 Fibonacci level and the 1.618 Fibonacci Extension.
Overall, In My Opinion, TRX has established an uptrend with consecutive lower highs, the market structure has changed. TRX needs to break current resistance levels in order to keep the bullish bias. Volume is looking very healthy for this break, so we do have a greater probability of breaking resistance and meeting technical target.
What are your thoughts on TRX trend change?
Please leave a like and comment,
And remember,
“If you don’t respect risk, eventually they’ll carry you out.” – Larry Hite

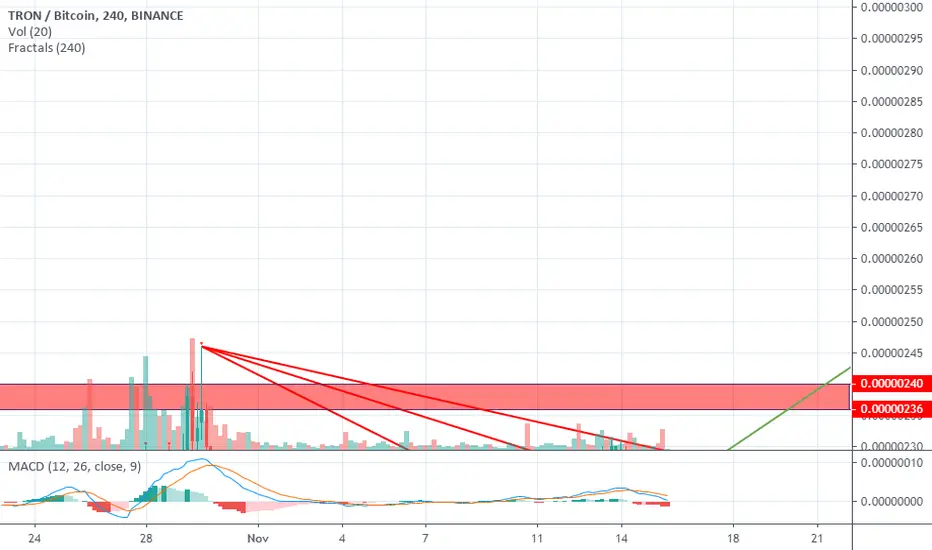
Still climbing - small gains. Need to get some tracktionRSI increasing, still following trendline. Need to break 246 for further bullish sky rocket moves :)
Stripped back naked analysis. Short term.Sweet and simple, just like me.
Only looking at past short term fractals here, married to the fact that this would be an ideal liquidity zone. We have seen 3 previous wicks down, with perfectly the same time scale between each one, the next (if it happens) is looming upon us.
I am already in a long leverage position, though this was entered much earlier.
Good luck.
The Gatekeeper.


INTRADAY MARKET UPDATEThe red column indicates to sell and the green column indicates to buy... Look at the most recent bar to see if it is a buy or a sell. Follow us to get updates on here every 2 hours for our system!
To effectively use our system you need to trade XRPBTC , EOSBTC , XBTUSD , ETHUSD , LTCBTC , TRXBTC , ADABTC and BCHBTC all at the same time on BitMEX. Our research shows that by creating a portfolio of trades we can reduce the drawdown on our portfolios on BitMEX. We keep 8 positions (1 on each) open at all times and swing trade following our system.
We are committed to helping traders get to the next level
Expected profits for 12 months following our ideas.
1BTC to 30BTC X1 leverage
1BTC to 100BTC X2 leverage
1BTC to 1000BTC X3 leverage
Best regards,
Ryan Grey

TRON Keeps On Growing | Where To Next? | Fib. TargetsTRON (TRXBTC) is on a clear uptrend and continues to grow.
Looking at the last bullish move, it printed a higher high and is showing signals of going further.
EMA10 continues to hold, while EMA100 has been conquered and tested as support.
Where will TRON go to next?
Take a look at EMA200 (0.00000262) or the 1.618 Fib. extension. This is our next and main target.
The blue dashed lines represent the different support levels.
The bulls are fully in control now of TRON and this pair tends to do long steady climb when it starts to move. So expect for the retraces to be short and for the growth to be long.
Namaste.

TRX/BTC could be a killer trade , MEWN MEWN MEWNClose above 220 sats on high tf and hold would be very bullish.
As we see every time it broke the weekly downtrend, it went up around 200%. 'The last weekly downtrend is broken, all we need is a high timeframe close above 220 satoshi. First target i see is around 300 sats, or it could go for the 55 daily moving avarage above. Lets mewn it

TRX ready after small cooldown - 245 first - then 275. U ready?RSI increaing, still holding trendline beutifully. Time to get up to those 4 digits tron!


$TRX, Trying to get some traction...$TRX
Trying to get some traction after some accumulation over support at ~210 sats
UCTS Buy signal on the 1D
Volume starting to rise again
Looking for an entry close to invalidation level, If happens ~265sats as target (Matching EMA200)
#TRX

Trxbtc is in accumulation phase ... its ready to moon .. Trx is perfoming very good and thanks to Justin for making it known in the world . for sure after lifting the cypto ban in China there is big potential for tron to move

$TRXBTC on the way up as well$TRX switched to the uptrend and it's making nice higher highs and higher lows. Currently sitting on the top of the accumulation zone, going upward on the MA20 slope.
Next target 6706.


TRX will be printing more green candles.TRX Daily Chart was not inspiring me, so I zoomed in a little (actually, H4 is my favorite configuration, but i prefer trading Daily trends). So here TRX is in a bull trend from start of September. It is making Higher Highs and Higher Lows, printing a Rising Channel.
210 sats has been an important Support / Resistance before, so I'm watching the price action here, and as usual, close below = bearish, close above = bullish.
The next support to long is around 180 sats and the lowest support is at 140 sats but I don't think it will reach that price anymore.

INTRADAY MARKET UPDATEThe red column indicates to sell and the green column indicates to buy... Look at the most recent bar to see if it is a buy or a sell. Follow us to get updates on here every 2 hours for our system!
To effectively use our system you need to trade XRPBTC , EOSBTC , XBTUSD , ETHUSD , LTCBTC , TRXBTC , ADABTC and BCHBTC all at the same time on BitMEX. Our research shows that by creating a portfolio of trades we can reduce the drawdown on our portfolios on BitMEX. We keep 8 positions (1 on each) open at all times and swing trade following our system.
We are committed to helping traders get to the next level
Expected profits for 12 months following our ideas.
1BTC to 30BTC X1 leverage
1BTC to 100BTC X2 leverage
1BTC to 1000BTC X3 leverage
Best regards,
Ryan Grey

TRX/BTCKeep it simple!
Green box is where you buy, Orange box is where you take profit. At each profit target I take out 20% of my initial trade.
If TRX holds the green box range and respects it as support then we can see TRX test previous resistance levels. If you had bought TRX at green box 1 you should have hit your first and second profit target already, and the trade has been very profitable!
TRX has so far touched the second orange box, retraced and now looks like it may do a re-test of the high. If it cant break above the second orange box range it is likely to come down and hit the second green box (2), where we want to see a strong hold for support.
It is key to note that the boxes are a range - therefore I ladder into my trades, which gives me a better entry and exit price.

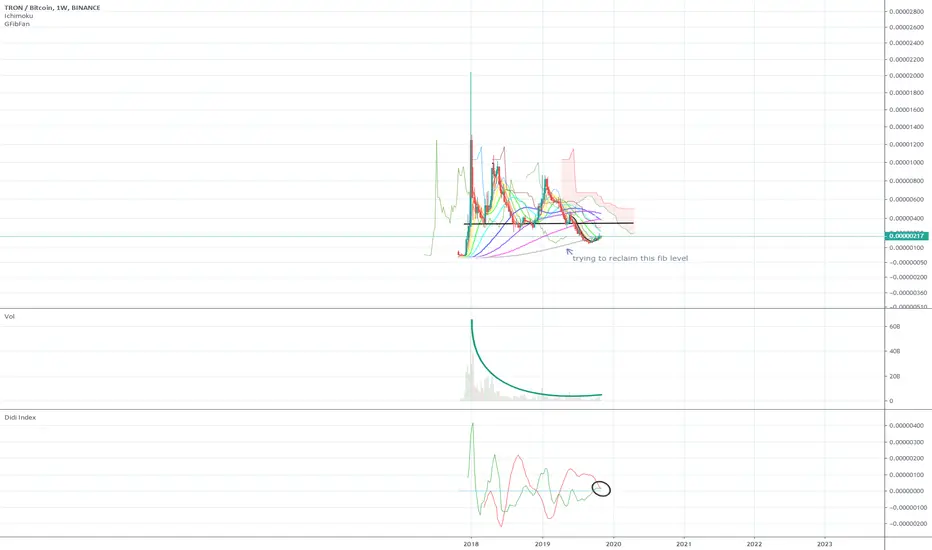
TRX/BTC FlipPretty bullish setup once Fibonacci level is reclaimed.
Please comment some coins you want to see charts of!