TRXBTC trade ideas

TRXBTC is ready to GO UPMFI(50) is changed its direction while price stay still.
Stochastic is turning as well.
Giving us great chance to make some money here.
JUST SEE what's coming.

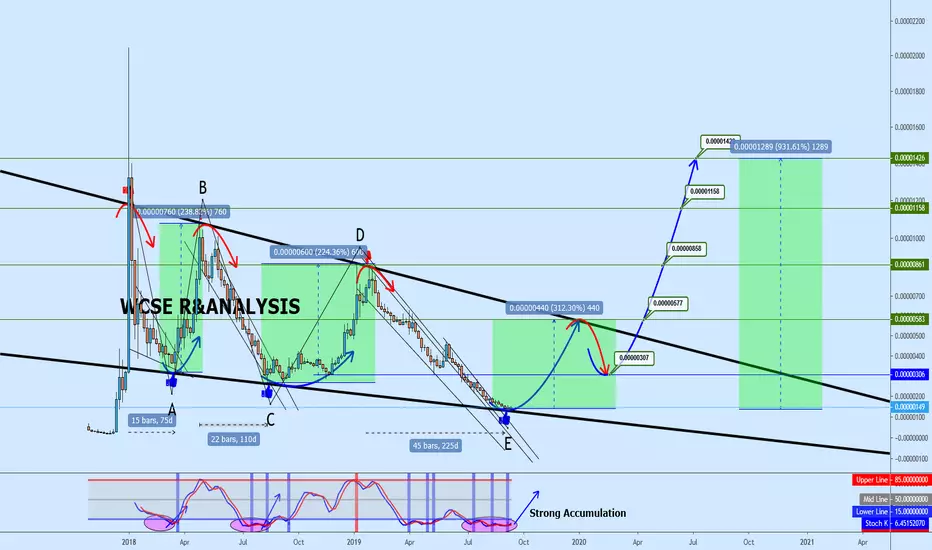
TrxBtc in Approaching strong bottomHello guys, Trx shown some action lately that pin point potential bottom approaching, I believe from now on accumulating TRX will not be a bad idea towards the level of 125sats.
Price trading in potential downtrend channel which almost hot the last down target and expecting major rally soon.
Looking through the past formation and price action towards the bottom zone suggested that price always form CUP when ever it bottomed out and i think same thing will be in play on TRX now.
Kindly follow the suggested accumulation zone on the chart and always remember to apply stop loss according to your risk mitigation.
Level to watch for are:
POSSIBLE ENTRY ZONE
SELL TARGETS
Do know that I appreciate your effort and the time spend in reading and watching my posts and Please leave a LIKE and FOLLOW us for more updates.
Thank you
Note:
It will be good to always understand risk involve in trading. Always trade with stop Loss in place.
Set up an entry/exit strategy for every trade, with good risk/reward ratio.
TRX/BTC - Bearish But Could Jump As A BounceTough one this failed push on the EMA34, this could go a lot lower if support is lost at the lower ends.
Be careful with this. Ensure you look at BTC.D it has to go down for a long period of time to allow a trend to form.


Tron about to fly off to the moon against BTCHaving a falling wedge within forming within several months is a rare thing to see on any chart. This chart is just beautiful and I expect the falling wedge to be broken upwards toward targets highlighted in chart in months. I have taken a position in this and would be very patient in the next few months.

Falling WedgeLook like falling wedge.
Wait for breakout, buy the breakout.
Don't buy before the breakout :)

TRON possible next move Tron has broken the LH pattern which means it has started an uptrend.
Next target to take profit is 165 Sats.

Warren Buffet invests into Tron? Would that be something!FYI: Buffet is sitting on record cash right now.
Would u want to dib your fingers into crypto when it is just starting to create long term value?
We all know Buffet is all about the big picture and value. And don;t u think, the CEO of Tron, will not brainwash him enough?
Considering, if, Trump and many other Crypto major players will be there,... HMM... so much brainwashing.
I don;t know about u, but being bullish now, is better.
So i buy the rumor first! Maybe you should too.
Good luck everyone ;)
**LEGENDS**
BLUE = Bear/Resistance
Yellow = Bull/ Support
Vertical Lines: Fractal dates are moments of interest, where price and time collide to create oscillation.
+F = Positive Fractal: Potential positive event with price increase.
+F = Positive Fractal: Potential positive event with price decrease.
~Explore the chart for possible scenarios of price actions - use zoom and scroll for better view.~
/*This information is not a recommendation to buy or sell. It is to be used for educational purposes only.*/
If you want your coin to be analyzed, JUST ask.
If you got a question, ASK away!
And please keep those Stop losses in place!
Thank you,
Ajion

TRX, DERROCHANDO MIEDO. Hemos visto que el pronostico fue acertado, creo ahora que estan derrochando miedo, cuando ha roto toda tendencia, cuando Justin Sun, no hace mas que regsarla, asi cuando ya no quieren a tron, ahi es cuando se compra no? suerte,

TRX - Looking Like More Drops To Come...TRX is having a tough time at the moment, Justin Sun the founder under a lot of heat and it is looking like the TRX holders are starting to sell at big losses right now. We suggest waiting as this has more to fall.

no sign of recoverytrx may see 50sat
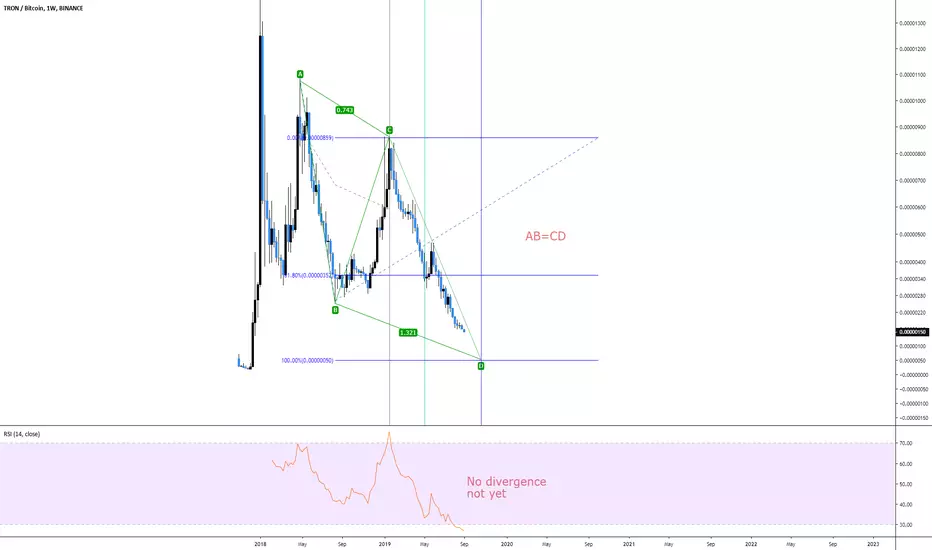
I can see a pattern in the chart
although we are in oversell area but no sign of positive divergence in weekly time frame so my experience says we go down in price and may see higher level in oscillators to create a divergence
every night before I go to my bed I just short it
wait for a reasonable sign, she will back one day
After hit the bottom trend line possible huge upside movement!BTC is dominate on every front but that can be ended once like everything what is moving in waves!
Many alts are in the same situation like TRX. Soon they will be all at level "now or never "

TRX/BTC Coin Prediction 2 Sept 2019BINANCE:TRXBTC
I would say this is great accumulation zone for mid term on TRX/BTC. It looks like forming double bottom, which is great for turning the trend. I think TRX will announced their upcoming big news on October or earlier.

Back testing Bikini Bot on TRX/BTC pair!Sorry about the budgie noise. Just enjoy the novelty of the birds chirping lmao.
To join BikiniBot go to www.bikinibotcrypto.com

thou choya shitcoin shall dieShort here with 10x leverage via bitmex.com , 2:1 risk/reward trade.
may thou margin callz be your stop loss.
Once the breakdown confirms, move your stop loss to break even.

TRX, QUIEREN LLEVARLO A 138 SATOS Se nota que la direccion de tron es seguir hacia abajo, estan metiendo miedo como siempre, cada vez son mas agresivos,
Pero como te digo Tron esta aqui para quedarse, no lo sueltes, es muy probable que den un bajon a los 138 satoshis, eso haria que aflojes tus posiciones si o si,
resiste, o entra conservadoramente, ( usando patrones de reversion) pero entraras un poco tarde, ya ahora, seria tonto soltar posiciones.
Hasta el final Sres, . si haces un movimiento a la alza en los 138, seria una excellente entrada o recompra.

TRX/BTC Another 20% Drop?Heads up TRX/BTC holders!
We could see another leg down on TRX/BTC pair.
Weekly bear flag in paint right now, Low volume and
multiple bear volume is seen. Drop below 0.00000130 -
0.00000120 is possible before we could see a small relief rally then head back down again.
Trade idea:
Ladder Longs between 0.00000130 - 0.00000120 Sats
Target: Up to 0.00000160
Stop loss: 0.00000110
Let's try this Free VIP signal on Bitmex and Binance!
Grab A friend and Earn up to $50 use this link below.
krypto-signals.com

TRON due for some PUMP?Watch this space, market at an all time low, looking for a possible upswing from current lows.
TRX - Reputation Damaged By Founder & China Issues?TRX has always had life in it even when Bitcoin would pump but every since the issues in China with Justin Sun, it appear it has only been a one way downwards with the bears.
There used to always be some marketing trick up the sleeve of the founder. But has that fizzled out.
Worrying times

TRX-LONGHigh guys ! we are going long here and looking to add more or take profit (RSI ) you can see everything .! this is not financial advice

[TRXBTC] Tron Trade Signal and chart analysis I still wait for Bitcoin dominance to come down and trend-line breaks.
----------------------------------------
ENTRY: 0.00000150 - 0.00000170
TARGET:
(1) 0.00000235
(2) 0.00000307
(3) 0.00000484
(4) 0.00000528
(5) 0.00000765
(6) 0.00000900
PROFITS POTENTIAL: 430%
(Buy calculated at 0.00000170)
STOP: Close weekly below 0.00000145.
----------------------------------------
Visit my Telegram channel:
t.me

