TRXBTC trade ideas

TRXBTC | MRMEGBINANCE:TRXBTC
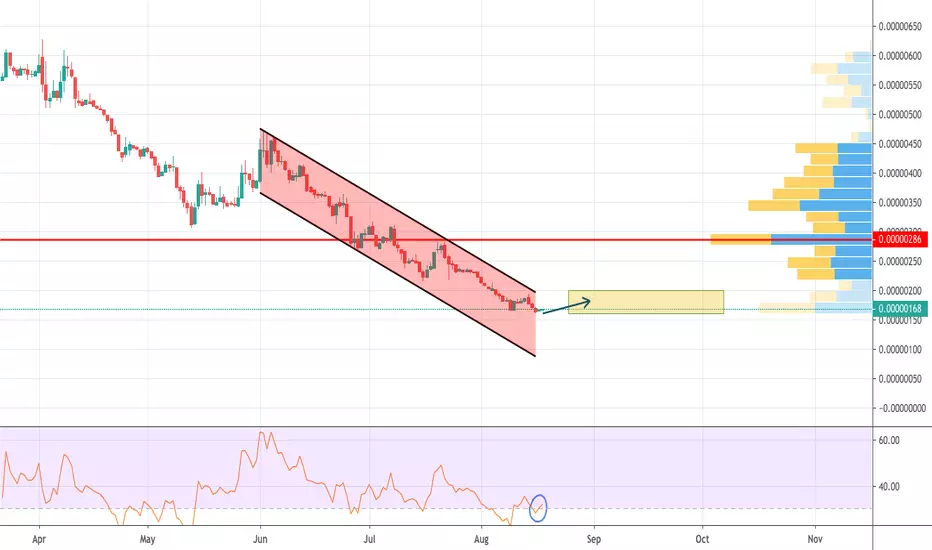
BUY: signa given in 171/172
TARGET : in telegram channel
BINANCE EXCHANGE
Follow and like to see more Analyze for coins in Binance
www.tradingview.com


Finally some real Bullish signs!If price holds above the upper trend-wedge line we have our next Bullish targets!
If this breakout is only a fake breakout than the previous scheme will be in the game again:
Anyway stops for this trade is under 0.0000011 so use money management for the worst-case scenario if you are long now!


TRX/BTC (Tron) Breakout In Daily TF..!!TRX/BTC (Tron)
- Looks Bullish & Strong & Looks Like Bottomed Out.
- Falling Wedge Breakout Done in daily Timeframe With Incredible Volume.
- MACD & RSI Bullish Divergence As Well IN Daily Chart.
- Almost 100% Profit Expected For Midterm..
Buy Around 160 - 172 Sats
Sell Targets 220 - 267 - 310 Sats
Scalp Targets 177 - 188 - 200 Sats
Stop Loss Below 150 Sats
Capital Allocation : 5-10%
Please, give us your opinion in the comments!
If you like the idea, please, hit the Like button and subscribe to the profile in order not to miss our updates.
Join Telegram Channel for more analysis - t.me
The information given is never financial advice. Always do your own research

Tron/Bitcoin (Aug 21) #TRX $TRX #BTC $BTCTRX will dump so deep and we will consider buying it in the range of 135-140
I say "Consider", not "Buy"


Please pay attention to TRX (100% more upside with NO LEVERAGE).Hi everyone.
THIS IS NOT A SHORT-TERM TRADE.
This analysis could happen in 2-3 Weeks.
Tron is on a huge Falling Wedge on the Weekly chart and we are on support zones.
RSI oversold and trying to become more bullish - Good Sign
MACD trying to cross on a positive way - Good Sign .
TRX could reach 340 Satoshis on the Midterm
With 10 X leverage, this is a 1000% Profit potential.
Please manage your own risk and trade properly.
This is an analysis from Financial Move, Financial Consulting Company.
Please know our job at www.financialmove.com.br

TRON - bottom was reachedEven though TRX continues its ongoing decline in a long-term scenario, the coin is giving profit to its holders in a short-term. The rate of Tron has increased by 1.56% over the day.
TRX is located in the oversold zone according to the RSI indicator. In this case, sellers are losing their positions, and the price is unlikely to go below the area of 160 satoshi. Taking into account that TRX is showing signs of revival, as well as other top coins, the rate is about to locate between the levels of 160 satoshi and 200 satoshi in the first part of autumn.
Tron reading up for some bullish volatility. Aug 13 is FractalI don;t know how much of a bullish case do i need to make here.
I strongly believe that chart speaks for itself here.
My assumption that between now, Aug 10 and 14, we shall know if i am correct in my assumption.
Good luck everyone ;)
**LEGENDS**
BLUE = Bear/Resistance
Yellow = Bull/ Support
~Explore the chart for possible scenarios of price actions - use zoom and scroll for better view.~
/*This information is not a recommendation to buy or sell. It is to be used for educational purposes only.*/
If you want your coin to be analyzed, JUST ask.
If you got a question, ASK away!
And please keep those Stop losses in place!
Fractal dates are moments of interest, where price and time collide to create oscillation - vertical lines!
Thank you,
Ajion

TRX/BTC WEEKLYI personally would like to see us go down to the box as you can see in Dec 2018 there was good support at 135 sats, That's where i'll be looking for an entry, MACD is still negative, and MA's are still pointing pointing down ATM, you will see price action closer to the MA Cross and MACD Crossing, bottom is close just a couple more weeks! I don't believe we will break below the support box because this Falling wedge has been playing out for quite some time, Probably going to pump super hard when it does break out.

TRX ( opportunity for investors ? )waiting price action in green box
sometimes wave (e) break the trend line so be careful

