TRX Poised for Breakout After Weeks of CompressionTRX has been consolidating in a tight range between 0.24 and 0.26 for several weeks, showing signs of strength in a weak market. Price action has been orderly, with higher lows tightening into flat resistance — a textbook buildup.
This kind of compression often leads to sharp directional movement, especially when paired with low volatility and reduced attention. Volume remains muted, but any breakout with conviction above 0.26 could spark a strong trend continuation
Invalidation: Breakdown of support or rejection with high sell volume near 0.26.
Watching closely. No need to predict — just react.
#TRX #Crypto #BreakoutSetup #Altcoins #TradingViewIdeas
TRXUSD trade ideas

TRONUSD: A pair to keep on your watchlistHello,
Another coin pair or coin available in the market to look out at is TRONUSD or Tron. According to Wikipedia, Tron (stylized as TRON) is a decentralized, proof-of-stake blockchain with smart contract functionality. TRON adopts a 3-layer architecture divided into storage layer, core layer, and application layer. The TRON protocol adheres to Google protocol buffers, which intrinsically supports multi-language extension.
Very important for investors to remember is that the TRON coin is very different from the TON coin. TRON has a market cap of $23.29B with an average volume of $716.35M in 24 hours. While the maximum supply of this coin remains infinity (acting against the coin), the current total supply of the coin is 94.95B coins (circulating supply).
From a technical point, the pair is currently undergoing a correction and may present better buying/holding opportunities in the future. Both the moving averages and the MACD indicator show that better buying opportunities will come once the pair moves closer to the moving averages or the MACD does a zero crossover.
What might cause the correction is the SEC legal challenges against Tron founder Justin Sun over alleged securities law violations and undisclosed celebrity endorsements. The support the current president is giving to the crypto markets might also be the catalyst for the next move to the upside. We see this as a great coin to add to your watchlist going forward due to the potential opportunities it has.
Disclosure: I am part of Trade Nation's Influencer program and receive a monthly fee for using their TradingView charts in my analysis.

Crypto update 2025.04.14The current market moves due to tariffs are pushing away the interest from cryptos, as those are stuck somewhere between potentially being a safe-haven and still classed as a risky asset.
Let's dig in.
CRYPTO:BTCUSD
CRYPTO:BCHUSD
CRYPTO:ETHUSD
CRYPTO:LTCUSD
Let us know what you think in the comments below.
Thank you.
77.3% of retail investor accounts lose money when trading CFDs with this provider. You should consider whether you understand how CFDs work and whether you can afford to take the high risk of losing your money. Past performance is not necessarily indicative of future results. The value of investments may fall as well as rise and the investor may not get back the amount initially invested. This content is not intended for nor applicable to residents of the UK. Cryptocurrency CFDs and spread bets are restricted in the UK for all retail clients.

TRON Showing StrengthTRX has made a strong move. It's consolidated nicely and is peaking out of the falling wedge. Things are looking great so far.

TRX bullish soon!CRYPTOCAP:TRX -@trondao
TRON is dedicated to building the infrastructure for a decentralized internet. 🌐
#TRX is currently rejecting a strong demand zone marked in blue.
For the bulls to take over and initiate the next upward impulse phase, a break above the last major high marked in green at $0.252 is needed.🚀


TRON The Week Ahead 17th March ‘25TRON (TRONUSD) remains in a bullish trend, supported by a longer-term uptrend. However, recent intraday price action suggests a sideways consolidation, with the rising support trendline acting as a key structural level.
Key Levels to Watch
Resistance Levels: 2,466, 2,614, 2,780
Support Levels: 2,034, 1,925, 1,741
Bullish Scenario
A successful bounce from the 2,034 support level, which aligns with the rising trendline and previous consolidation zone, could confirm bullish continuation. If buyers step in at this level, TRON could target the next resistance at 2,466, followed by 2,614 and potentially 2,780 over the longer term.
Bearish Scenario
A confirmed breakdown below 2,034, with a daily close beneath this level, would weaken the bullish outlook. This could lead to a deeper correction toward the 1,925 support level, with extended downside risk toward 1,741 if bearish momentum accelerates.
Conclusion
TRON remains in a broader uptrend, but the 2,034 level serves as a key pivot zone. A bounce from this level would reaffirm bullish strength, while a breakdown could lead to further downside corrections. Traders should watch price action around these levels for confirmation of the next directional move.
This communication is for informational purposes only and should not be viewed as any form of recommendation as to a particular course of action or as investment advice. It is not intended as an offer or solicitation for the purchase or sale of any financial instrument or as an official confirmation of any transaction. Opinions, estimates and assumptions expressed herein are made as of the date of this communication and are subject to change without notice. This communication has been prepared based upon information, including market prices, data and other information, believed to be reliable; however, Trade Nation does not warrant its completeness or accuracy. All market prices and market data contained in or attached to this communication are indicative and subject to change without notice.

TRXUSDT: Possible buy trend shiftTRXUSDT: Possible buy trend shift. We see RSI divergence at the support level. If price breaks above the resistance line with high volume, then buy setup activates.

TRON Retesting Important support at 2,190TRON (TRONUSD) remains in a bullish trend, supported by a longer-term uptrend. However, recent intraday price action suggests a sideways consolidation, with the rising support trendline acting as a key structural level.
Key Levels to Watch
Resistance Levels: 2,466, 2,614, 2,780
Support Levels: 2,034, 1,925, 1,741
Bullish Scenario
A successful bounce from the 2,034 support level, which aligns with the rising trendline and previous consolidation zone, could confirm bullish continuation. If buyers step in at this level, TRON could target the next resistance at 2,466, followed by 2,614 and potentially 2,780 over the longer term.
Bearish Scenario
A confirmed breakdown below 2,034, with a daily close beneath this level, would weaken the bullish outlook. This could lead to a deeper correction toward the 1,925 support level, with extended downside risk toward 1,741 if bearish momentum accelerates.
Conclusion
TRON remains in a broader uptrend, but the 2,034 level serves as a key pivot zone. A bounce from this level would reaffirm bullish strength, while a breakdown could lead to further downside corrections. Traders should watch price action around these levels for confirmation of the next directional move.
This communication is for informational purposes only and should not be viewed as any form of recommendation as to a particular course of action or as investment advice. It is not intended as an offer or solicitation for the purchase or sale of any financial instrument or as an official confirmation of any transaction. Opinions, estimates and assumptions expressed herein are made as of the date of this communication and are subject to change without notice. This communication has been prepared based upon information, including market prices, data and other information, believed to be reliable; however, Trade Nation does not warrant its completeness or accuracy. All market prices and market data contained in or attached to this communication are indicative and subject to change without notice.

TRXUSD Another 2 months of consolidation is possible.Last time we looked at TRON (TRXUSD) was almost 6 months ago (September 25 2024, see chart below) when we called for a 1D MA50 (blue trend-line) buy:
The immediate rally that followed, hit our 0.2100 Target in less than 2 months, even breaking above the long-term Channel Up. Since then, the Bullish Leg deflated and settled sideways on a trade within the 1D MA50 (blue trend-line) and 1D MA200 (orange trend-line).
This is an Accumulation Phase and on the current 2023 - 2025 Bull Cycle, it is not the first time we've seen one. In fact the Higher Lows Zone had such phases since its start but the most notable and most similar to the current one is the one between March - August 2024.
Always supported by the 1W MA50 (red trend-line), this Accumulation Phase displayed the same kind of 1D MACD Bullish Divergence and once it formed its first Higher Highs trend-line and rebounded on the 1D MA200, it entered the Parabolic Rally Phase.
If the symmetry holds, then we might see TRX hit 0.6000 by September 2025.
-------------------------------------------------------------------------------
** Please LIKE 👍, FOLLOW ✅, SHARE 🙌 and COMMENT ✍ if you enjoy this idea! Also share your ideas and charts in the comments section below! This is best way to keep it relevant, support us, keep the content here free and allow the idea to reach as many people as possible. **
-------------------------------------------------------------------------------
💸💸💸💸💸💸
👇 👇 👇 👇 👇 👇

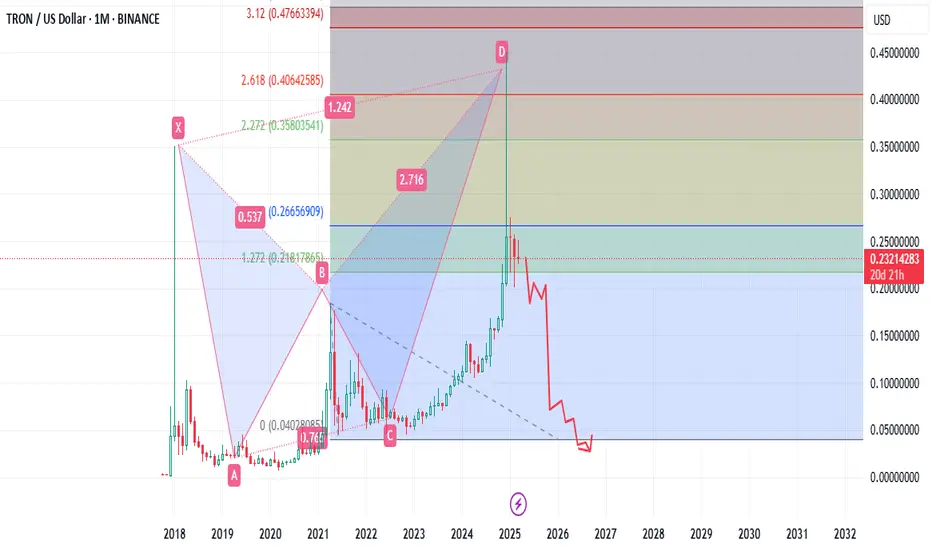
The Whole Chart is a Bearish BatTheir are sketchy things, there are very sketchy things and there's having your entire charting history forming a bearish bat pattern and dumping 50% off the PRZ.
This is one of those extremely rate PRZ things.
Generally in a topping market what we tend to see is a 50% capitulation. Followed by some sort of bounce and then the downtrend.
This attempt at a bounce is ... terrible.
All the move contained inside of the 1.27 - 1.61 (odds in a random walk?).
If and when this 1.27 gives up as support, it's going to be rough times for this one.
TRON (TRONUSD) The Week Ahead 10th march '25TRON (TRONUSD) remains in a bullish trend, supported by a longer-term uptrend. However, recent intraday price action suggests a sideways consolidation, with the rising support trendline acting as a key structural level.
Key Levels to Watch
Resistance Levels: 2,466, 2,614, 2,780
Support Levels: 2,034, 1,925, 1,741
Bullish Scenario
A successful bounce from the 2,034 support level, which aligns with the rising trendline and previous consolidation zone, could confirm bullish continuation. If buyers step in at this level, TRON could target the next resistance at 2,466, followed by 2,614 and potentially 2,780 over the longer term.
Bearish Scenario
A confirmed breakdown below 2,034, with a daily close beneath this level, would weaken the bullish outlook. This could lead to a deeper correction toward the 1,925 support level, with extended downside risk toward 1,741 if bearish momentum accelerates.
Conclusion
TRON remains in a broader uptrend, but the 2,034 level serves as a key pivot zone. A bounce from this level would reaffirm bullish strength, while a breakdown could lead to further downside corrections. Traders should watch price action around these levels for confirmation of the next directional move.
This communication is for informational purposes only and should not be viewed as any form of recommendation as to a particular course of action or as investment advice. It is not intended as an offer or solicitation for the purchase or sale of any financial instrument or as an official confirmation of any transaction. Opinions, estimates and assumptions expressed herein are made as of the date of this communication and are subject to change without notice. This communication has been prepared based upon information, including market prices, data and other information, believed to be reliable; however, Trade Nation does not warrant its completeness or accuracy. All market prices and market data contained in or attached to this communication are indicative and subject to change without notice.

TRON (TRONUSD) sideways consolidationSentiment: Neutral, Price action is consolidating in a tight trading range.
Resistance: Key Resistance is at 2476, followed by 2588 and 2718.
Support: Key support is at 2277 followed by 2157 and 2000.
This communication is for informational purposes only and should not be viewed as any form of recommendation as to a particular course of action or as investment advice. It is not intended as an offer or solicitation for the purchase or sale of any financial instrument or as an official confirmation of any transaction. Opinions, estimates and assumptions expressed herein are made as of the date of this communication and are subject to change without notice. This communication has been prepared based upon information, including market prices, data and other information, believed to be reliable; however, Trade Nation does not warrant its completeness or accuracy. All market prices and market data contained in or attached to this communication are indicative and subject to change without notice.

TRX Stock Chart Fibonacci Analysis 030225Trading Idea
1) Find a FIBO slingshot
2) Check FIBO 61.80% level
3) Entry Point > 0.24/61.80%
Chart time frame: C
A) 15 min(1W-3M)
B) 1 hr(3M-6M)
C) 4 hr(6M-1year)
D) 1 day(1-3years)
Stock progress: C
A) Keep rising over 61.80% resistance
B) 61.80% resistance
C) 61.80% support
D) Hit the bottom
E) Hit the top
Stocks rise as they rise from support and fall from resistance. Our goal is to find a low support point and enter. It can be referred to as buying at the pullback point. The pullback point can be found with a Fibonacci extension of 61.80%. This is a step to find entry level. 1) Find a triangle (Fibonacci Speed Fan Line) that connects the high (resistance) and low (support) points of the stock in progress, where it is continuously expressed as a Slingshot, 2) and create a Fibonacci extension level for the first rising wave from the start point of slingshot pattern.
When the current price goes over 61.80% level , that can be a good entry point, especially if the SMA 100 and 200 curves are gathered together at 61.80%, it is a very good entry point.
As a great help, tradingview provides these Fibonacci speed fan lines and extension levels with ease. So if you use the Fibonacci fan line, the extension level, and the SMA 100/200 curve well, you can find an entry point for the stock market. At least you have to enter at this low point to avoid trading failure, and if you are skilled at entering this low point, with fibonacci6180 technique, your reading skill to chart will be greatly improved.
If you want to do day trading, please set the time frame to 5 minutes or 15 minutes, and you will see many of the low point of rising stocks.
If want to prefer long term range trading, you can set the time frame to 1 hr or 1 day.

TRON (TRONUSD) Key trading levels, The week ahead 03rg March ‘25TRON (TRONUSD) remains in a bullish trend, supported by a longer-term uptrend. However, recent intraday price action suggests a sideways consolidation, with the rising support trendline acting as a key structural level.
Key Levels to Watch
Resistance Levels: 2,466, 2,614, 2,780
Support Levels: 2,034, 1,925, 1,741
Bullish Scenario
A successful bounce from the 2,034 support level, which aligns with the rising trendline and previous consolidation zone, could confirm bullish continuation. If buyers step in at this level, TRON could target the next resistance at 2,466, followed by 2,614 and potentially 2,780 over the longer term.
Bearish Scenario
A confirmed breakdown below 2,034, with a daily close beneath this level, would weaken the bullish outlook. This could lead to a deeper correction toward the 1,925 support level, with extended downside risk toward 1,741 if bearish momentum accelerates.
Conclusion
TRON remains in a broader uptrend, but the 2,034 level serves as a key pivot zone. A bounce from this level would reaffirm bullish strength, while a breakdown could lead to further downside corrections. Traders should watch price action around these levels for confirmation of the next directional move.
This communication is for informational purposes only and should not be viewed as any form of recommendation as to a particular course of action or as investment advice. It is not intended as an offer or solicitation for the purchase or sale of any financial instrument or as an official confirmation of any transaction. Opinions, estimates and assumptions expressed herein are made as of the date of this communication and are subject to change without notice. This communication has been prepared based upon information, including market prices, data and other information, believed to be reliable; however, Trade Nation does not warrant its completeness or accuracy. All market prices and market data contained in or attached to this communication are indicative and subject to change without notice.

TRON The Week Ahead 24 Feb ‘25The TRON (TRONUSD) currency pair price action sentiment appears bullish, supported by the longer-term prevailing uptrend. The recent intraday price action appears to be a sideways consolidation towards the rising support trendline zone.
The key trading level is at 2,034 level, the previous consolidation price range and also the rising support trendline zone. A corrective pullback from the current levels and a bullish bounce back from the 2,034 level could target the upside resistance at 1,466 followed by the 2,614 and 2,780 levels over the longer timeframe.
Alternatively, a confirmed loss of the 2,034 support and a daily close below that level would negate the bullish outlook opening the way for a further retracement and a retest of 1,925 support level followed by 1,741.
This communication is for informational purposes only and should not be viewed as any form of recommendation as to a particular course of action or as investment advice. It is not intended as an offer or solicitation for the purchase or sale of any financial instrument or as an official confirmation of any transaction. Opinions, estimates and assumptions expressed herein are made as of the date of this communication and are subject to change without notice. This communication has been prepared based upon information, including market prices, data and other information, believed to be reliable; however, Trade Nation does not warrant its completeness or accuracy. All market prices and market data contained in or attached to this communication are indicative and subject to change without notice.

TRXUSD - Large Slanted W Pattern IdeaUsing the peak in the middle as the middle of the W pattern we can assume there will be a right hand side of the W implying the bulls are coming
I'm not sure how high it will go but 7 sounds interesting
I often see this pattern and believe we are still waiting for an alt season for these older coins
Daily timeframe

TRON Key trading level at 2300The key trading level is 2300
This communication is for informational purposes only and should not be viewed as any form of recommendation as to a particular course of action or as investment advice. It is not intended as an offer or solicitation for the purchase or sale of any financial instrument or as an official confirmation of any transaction. Opinions, estimates and assumptions expressed herein are made as of the date of this communication and are subject to change without notice. This communication has been prepared based upon information, including market prices, data and other information, believed to be reliable; however, Trade Nation does not warrant its completeness or accuracy. All market prices and market data contained in or attached to this communication are indicative and subject to change without notice.

TRON The Week Ahead 17th Feb 25The TRON (TRONUSD) currency pair price action sentiment appears bullish, supported by the longer-term prevailing uptrend. The recent intraday price action appears to be a sideways consolidation towards the rising support trendline zone.
The key trading level is at 2,034 level, the previous consolidation price range and also the rising support trendline zone. A corrective pullback from the current levels and a bullish bounce back from the 2,034 level could target the upside resistance at 1,466 followed by the 2,614 and 2,780 levels over the longer timeframe.
Alternatively, a confirmed loss of the 2,034 support and a daily close below that level would negate the bullish outlook opening the way for a further retracement and a retest of 1,925 support level followed by 1,741.
This communication is for informational purposes only and should not be viewed as any form of recommendation as to a particular course of action or as investment advice. It is not intended as an offer or solicitation for the purchase or sale of any financial instrument or as an official confirmation of any transaction. Opinions, estimates and assumptions expressed herein are made as of the date of this communication and are subject to change without notice. This communication has been prepared based upon information, including market prices, data and other information, believed to be reliable; however, Trade Nation does not warrant its completeness or accuracy. All market prices and market data contained in or attached to this communication are indicative and subject to change without notice.

TRX/USD "Tron vs US Dollar" Crypto Market Heist Plan🌟Hi! Hola! Ola! Bonjour! Hallo!🌟
Dear Money Makers & Thieves, 🤑 💰🐱👤🐱🏍
Based on 🔥Thief Trading style technical and fundamental analysis🔥, here is our master plan to heist the TRX/USD "Tron vs US Dollar" Crypto Market. Please adhere to the strategy I've outlined in the chart, which emphasizes long entry. Our aim is the high-risk Red Zone. Risky level, overbought market, consolidation, trend reversal, trap at the level where traders and bearish robbers are stronger. 🏆💸Book Profits, Be wealthy and safe trade.💪🏆🎉
Entry 📈 : "The heist is on! Wait for the MA breakout (0.25000) then make your move - Bullish profits await!"
however I advise to placing the Buy Stop Orders above the breakout MA or placing the Buy limit orders within a 15 or 30 minute timeframe. Entry from the most recent or closest low or high level should be in retest.
Stop Loss 🛑: Thief SL placed at 0.22800 (swing Trade Basis) Using the 4H period, the recent / Swing Low or High level.
SL is based on your risk of the trade, lot size and how many multiple orders you have to take.
Target 🎯: 0.30000 (or) Escape Before the Target
🧲Scalpers, take note 👀 : only scalp on the Long side. If you have a lot of money, you can go straight away; if not, you can join swing traders and carry out the robbery plan. Use trailing SL to safeguard your money 💰.
📰🗞️Fundamental, Macro, COT, Sentimental Outlook:
TRX/USD "Tron vs US Dollar" Crypto Market is currently experiencing a bullish trend,., driven by several key factors.
⭐Market Overview
Current Price: 0.24000
Daily Change: 3.5%
Weekly Change: 12.1%
⭐Fundamental Analysis
Tron Adoption: Growing adoption of Tron's blockchain technology, with increasing partnerships with major companies and organizations
DApp Ecosystem: Tron's DApp ecosystem is growing rapidly, with new DApps being launched regularly
Regulatory Environment: The regulatory environment for TRX is still uncertain, which could impact its price
⭐Macro Economics
Global Economic Trends: The ongoing global economic recovery is expected to drive up demand for cryptocurrencies, including TRX
Inflation Rate: Global inflation is expected to rise to 3.8% in 2025, potentially increasing demand for cryptocurrencies as a hedge against inflation
Interest Rates: Central banks are expected to maintain low interest rates in 2025, supporting cryptocurrency markets
⭐COT Data
Net Long Positions: Institutional traders have increased their net long positions in TRX to 58%
COT Ratio: The COT ratio has risen to 2.3, indicating a bullish trend
Open Interest: Open interest in TRX futures has increased by 18% over the past month, indicating growing investor interest
⭐Sentimental Outlook
Institutional Sentiment: 62% bullish, 38% bearish
Retail Sentiment: 58% bullish, 42% bearish
Market Mood: The overall market mood is bullish, with a sentiment score of +35
⭐Technical Analysis
Moving Averages: 50-period SMA: 0.22000, 200-period SMA: 0.20000.
Relative Strength Index (RSI): 4-hour chart: 64.21, daily chart: 60.14.
Bollinger Bands: 4-hour chart: 0.24000 (upper band), 0.22000 (lower band).
⭐Next Move Prediction
Bullish Move: Potential upside to 0.28000-0.30000.
Target: 0.28000 (primary target), 0.30000 (secondary target)
Stop Loss: 0.20000 (below the swing low)
Risk-Reward Ratio: 1:2 (potential profit of 0.06000 vs potential loss of 0.03000)
⭐Overall Outlook
The overall outlook for TRX/USD is bullish, driven by a combination of fundamental, technical, and sentimental factors. The expected increase in Tron adoption, growing DApp ecosystem, and bullish market sentiment are all supporting the bullish trend. However, investors should remain cautious of potential downside risks, including changes in global economic trends and unexpected regulatory developments.
⚠️Trading Alert : News Releases and Position Management 📰 🗞️ 🚫🚏
As a reminder, news releases can have a significant impact on market prices and volatility. To minimize potential losses and protect your running positions,
we recommend the following:
Avoid taking new trades during news releases
Use trailing stop-loss orders to protect your running positions and lock in profits
📌Please note that this is a general analysis and not personalized investment advice. It's essential to consider your own risk tolerance and market analysis before making any investment decisions.
📌Keep in mind that these factors can change rapidly, and it's essential to stay up-to-date with market developments and adjust your analysis accordingly.
💖Supporting our robbery plan will enable us to effortlessly make and steal money 💰💵 Tell your friends, Colleagues and family to follow, like, and share. Boost the strength of our robbery team. Every day in this market make money with ease by using the Thief Trading Style.🏆💪🤝❤️🎉🚀
I'll see you soon with another heist plan, so stay tuned 🤑🐱👤🤗🤩

Scalping & Mid-Term Analysis for TRONMarket Overview:
Trend: TRX remains in an overall uptrend on higher timeframes, but short-term weakness suggests consolidation.
Key Levels:
Resistance: ~$0.261 - $0.265
Support: ~$0.236 - $0.240 (weak), ~$0.206 (stronger)
Indicators:
MACD: Neutral on the daily, slightly bullish on lower timeframes.
RSI: Recovering from oversold levels, attempting to build bullish momentum.
EMA: Price is above the 200 EMA, confirming long-term bullish structure.
🔥 Scalping Strategy:
🩸 1. Range Scalping (Current Setup)
Why? TRX is holding key support levels but facing resistance at $0.261.
How?
Buy near $0.236, aiming for a scalp to $0.250 - $0.255.
Sell near $0.261 - $0.265, where resistance is strong.
Stop-loss below $0.233, as a break lower could trigger further decline.
🩸 2. Breakout Scalping (If Volatility Increases)
Trigger: A breakout above $0.265 or breakdown below $0.236.
Execution:
If TRX breaks $0.265, scalp long targeting $0.275 - $0.280.
If TRX drops below $0.236, scalp short to $0.220 - $0.206.
🩸 3. EMA Scalping
Why? Price is holding above the 200 EMA, meaning dips are being bought.
Execution:
Buy on EMA retest (~$0.236 - $0.240) if price doesn’t break below.
Sell near $0.261 resistance if price fails to push higher.
🔥 Mid-Term Trend Forecast (1-3 Weeks)
Bias: Bullish → Neutral
Why?
TRX is still holding above key moving averages, confirming long-term strength.
However, it needs to break above $0.265 to trigger new upside momentum.
If $0.236 fails as support, a deeper correction to $0.220 - $0.206 is likely.
A confirmed breakout above $0.265 will target $0.280 - $0.300.
🔥 News & Market Context:
Market sentiment remains mixed, meaning TRX will likely trade in a range before making a bigger move.
Whales are likely accumulating near support, but without a strong catalyst, a breakout isn’t guaranteed yet.
Watch for Bitcoin’s movement, as TRX tends to follow overall market sentiment.
🔥 Decision: Enter or Stay Out?
🩸 Short-term: Scalping the range is ideal, with buys near $0.236 and sells near $0.261.
🩸 Mid-term: Bullish unless TRX loses $0.236, which could shift momentum downward.
🩸 Ideal Play: Scalp long near support, but watch for rejection near resistance before entering larger positions.
👑 Final Verdict:
TRON is still holding strong, but facing key resistance at $0.261. If bulls can break it, expect $0.280 next. Otherwise, a retest of $0.220 - $0.206 is possible before the next leg up. 🔥

TRON - Buy Idea (Medium-term)Tron is gearing up for an upside reversal. Finding a solid bottom on the last line of resort at $0.2186 is a strong indication that this downside move is coming to an end. We decided to launch a new bullish campaign, targeting the two next significant key-level resistances of $0.2513 and $0.2878 respectively. Stay tuned...

Torn has not broken long term suportBased on simple trendlines TRON is still holding up against a reduction in stable coins minted on TRON vs SOL in recent times despite challenging tokenomics. Perhaps it’s seen as the alternative to US dollars domiciled chains, perhaps with the memory of a once hostile US to crypto. Maybe TRON dumps once this narrative is reversed ??
