TRON #TRON Testing strong resistance LineTRON #TRON
Testing strong resistance Line
As of today at 0.10679, the target goes to 0.1095.
Range between support 0.0974 and Resistance at 0.10954
Watch the MACD, almost uptrend.
DYOR, Not a financial advice,
Based on technical analysis.
Happy Holidays.
24Dec2023.
TRXUSDT trade ideas

TRXUSDT LONG TRADE IDEA 24-12-2023TRX is printing a Bullish Rectangle
ENTRY: 0.10685
SL: 0.106170
TP-1 0.10751
TP-2 0.10820
TP-3 0.10886
TP-4 0.10959

Looking for the big shortWe've come to the very end of this crypto cycle, market makers have begun distributing the coins to the retail. I am going over the charts and trying to figure out what token carries the best R:R reward with a short position. TRX and SOL seem like the best candidates, but TRX has an edge, as litigation against the organizer of this scheme will likely start soon. The legal process against J. Sun and his criminal enterprise will surely spook many who have investments in TRX and a myriad of other tokens revolving around J. Sun.
With this short, we are looking at a classic FOMO setup which has trapped many bulls at these inflated prices, many with high leverage. Indicators are already showing that distribution is ongoing as market maker have started to sell, and bulls have not been able to pass the 0.107 resistance for a month now while the volume declines. All factors show a high potential in a short position.
This alone should cause a correction and leverage the market to at least 0.0825 USDT per token. However, as mentioned before, there is a high chance of legal action against the organizer of this crypto scam and that could cause a deeper correction. If this does happen during the December, TRX could correct down to 0.06250 - which is indeed a target price for this trade.
Stay safe and on high alert, this is a highly manipulated market and many exchanges are business partners with J. Sun and his criminal venture.

TRX | USDT - Tron is part of my Top picks for 2024The recent one-day Tron price analysis confirms a noticeable recovery in the cryptocurrency value today. The price has been covering an ascending path since the past 24-hours, as the buying activity is on the rise. Because of the latest upward spike, TRX/USD value has leveled up to $0.1028 high. On the opposite hand, the Moving Average (MA) value dropped down to $0.1028 because of the previous bearish activity.

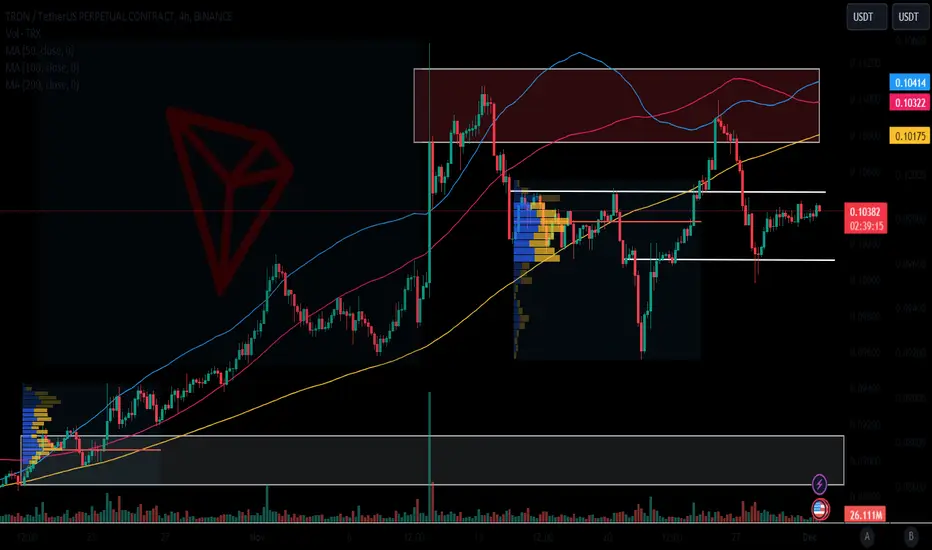
TRX/USDT Bullish Potential from Support Zone? 👀🚀TRON Analysis💎 Paradisers, let's focus on #TRXUSDT as it’s currently displaying a compelling pattern. The asset is exhibiting signs that suggest a bullish continuation from its support zone.
💎 Reflecting on #TRON recent market behavior, it has adeptly maneuvered through a descending channel, breaking upwards to signal a positive trend. At present, if TRX successfully retests the key support at $0.10358 and maintains its momentum above this level, there’s a high probability of witnessing a bullish move.
💎 This bullish sentiment is further bolstered by TRX’s strong momentum above the EMA. With sustained upward momentum, AMEX:TRX is likely to aim for the significant resistance at $0.10857.
💎 Additionally, keep an eye out for a possible bullish recovery from a slightly lower support level at $0.10244. However, a break below this level could signal potential difficulties in continuing the bullish trend.
💎 Equally important is being prepared for a shift in market dynamics. If #TRX dips below the $0.10244 support level, it could indicate a notable downward movement in the market. 🌴💰

TRX/USDT LONGPotential long?
Oscillators bounce with 1-2 hidden divergence getting printed and turning from red to green while pointing upwards, Would like the jewel turning white while pointing up before taking this trade. If so it could indicate a really nice short term scalp with some nice profit and small loss with tp and really close stop loss.
Reward ratio at 4+
I usually go 5-10x leverage with portfolio at around 3-5%
trades like this are very effective in the way that you can lose 4 trades and win one and still be in profit.
for perfect entry the jewel should turn white while pointing up. Thats the trigger point for me
same as last, just with added tp for people who believes it could go higher. Gigachad hold
for tp. 2 gold
Remember to move stop loss when taking profit to gain these gainzzz

trx/usdt longPotential long?
Oscillators bounce with 1-2 hidden divergence getting printed and turning from red to green while pointing upwards, Would like the jewel turning white while pointing up before taking this trade. If so it could indicate a really nice short term scalp with some nice profit and small loss with tp and really close stop loss.
Reward ratio at 4+
I usually go 5-10x leverage with portfolio at around 3-5%
trades like this are very effective in the way that you can lose 4 trades and win one and still be in profit.
for perfect entry the jewel should turn white while pointing up. Thats the trigger point for me

Check the chart TRX on the daily time frameIn the TRX review in the daily time frame, we find that this token has faced buying pressure at different stages with the transfer of orders, and at the last stage, it has suffered a failure in orders and has formed a level of pending purchsea orders and a backlog of orders, which with Moving towards this area and settlement of sellers' transactions continues its upward trend and moves to the higher supply area.

✴️ Tron To Enter Corrective Phase (New ATH Date Revealed)Tron (TRXUSDT) has been growing since mid-November 2022 and this theme is very likely to continue. What we are about to experience is a short/mid-term correction just as it happened in early 2023.
This correction can last 1-2 months.
Allow for within 3 months to be safe.
We see prices trading below EMA50 after a lower high.
The MACD and RSI both turned bearish and are trending down strong.
Hard for me to predict the end support right now but the initial move should be a strong, "surprise" flash crash and the rest more controlled.
It will be fun to watch and profitable for those who are short.
Spot traders can get out, secure profits, and wait for the next support level to form. There is always plenty of time to enter again and I will be sharing tons of charts/trade ideas/trade-numbers letting you know when we are close to change.
This is how the chart says it will go:
➖ We get a correction now ending in a long-term higher low;
➖ Followed by the start of the major bull-market in 2024.
➖ New All-Time Highs likely to hit in 2025 with some in 2024.
Namaste.


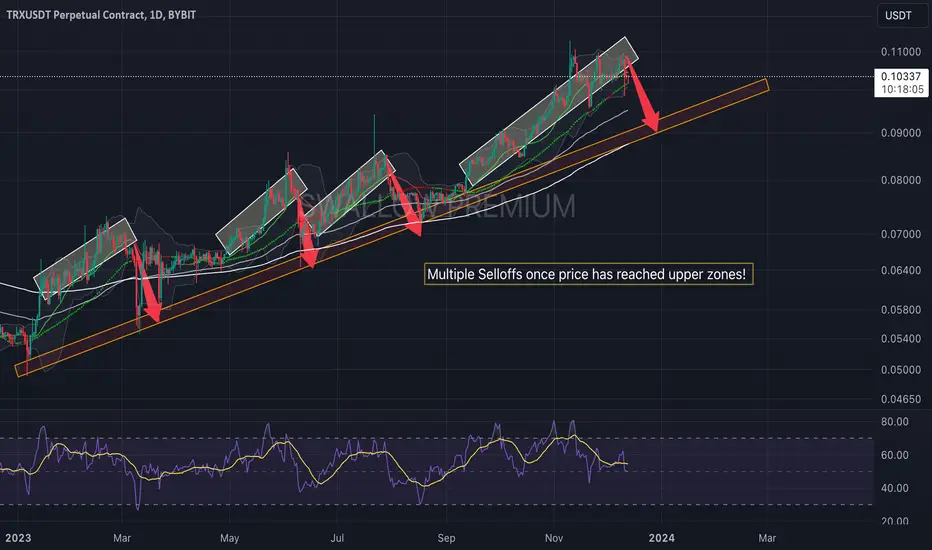
Tron(TRX): Similar Pattern = Drop IncomingTRX has caught our attention with a similar pattern to happen soon. First things first, the price of TRX has had an amazing bullish trend, moving and rebounding from it from time to time, but what is more interesting is how it is testing that zone.
A similar pattern might happen soon, so keep your eyes open for a potential downward movement towards that trend line!

SasanSeifi 💁♂TRX /USDT 4HHi there,
As you can see in the 4-hour timeframe, the price has had a nice run-up from the demand zone at 0.096, growing 17%. However, it has since been corrected back to the support zone. It's still in a range-bound pattern, but there are a couple of possible scenarios that we can consider.
One possibility is that the price will continue to be range-bound for a while longer. If it can maintain the support and resistance levels at 0.10300/0.10, it could then break out to the upside and reach the next resistance level at 0.10700. If it breaks through this level, it could then reach the next resistance level at 0.11000.
Another possibility is that the price will break down from the support level at 0.096. If this happens, it could then reach the next support level at 0.097.
🔵Remember, always conduct your own analysis and consider other factors before making any trading decisions. Good luck!"✌️
❎ (DYOR)...⚠️⚜️
Sure, if you have any more questions or need further clarification, feel free to ask. I'm here to help!
if you found my analysis helpful, I would appreciate it if you could show your support by liking and commenting. Thank you!🙌

Tron Bullish flagNASDAQ:TRON try to break 7 days and 14 hours consolidation,
and performing bullish flag.
Target from this pattern at same level as B point (previous fibonacci analysis)
to follow bullish movement, we can enter at flag support or wait at major support.
and set target at pattern projection at 0.10976
or set at maximum target 0.11549

Update on $TRXUpdate on AMEX:TRX if we still hold the green area then i will still consider the trend up, until we break the red line then i will consider the direction of the arrow below as my target
#TRX
#TRXUSDT

TRX LONGSince its almost all coins get bullish. BTC hits 41k. TRX shows minimal movement and its on a sideways. I just wish this time after hitting the demand zone, price can move upward just like my plan. :)


Tron ($TRX) Exhibiting Strong Growth Potential
TRX buyers have been quite active, causing the cryptocurrency to test the resistance zone of $0.110-$0.113 on three occasions since November 8, as it tries to break through this range and set a new yearly high.
Currently, there's a noticeable reduction in TRX's volatility, making it likely to see short-term trading within a flat range, specifically between support levels of $0.100 and $0.106. The potential for the TRX growth still exists as long as BTC remains trading above the $31,000 threshold.
A correction in TRX's trajectory is not expected to lead to significantly negative outcomes. If there is a decline, Tron might retest the support levels at $0.095-$0.097, $0.0935, and $0.0885-$0.0905. Given its robust upward trend, TRX is viewed as a viable addition to portfolios, particularly during periods of BTC correction.
TRX is coming to unload!!!The redistribution of the coin occurred in the Control ZONE 0.0458-0.0870
The average volume price is 0.656
We are going to unload in the ZONE 0.293-0.989
To the level of 0.489

TRX/USDT Ready for an Explosive Journey? 👀🚀TRX Analysis💎Yello, Paradisers! brace yourselves for an exciting trading prospect with TRXUSDT. Currently, the asset is displaying substantial activity in the demand zone, hinting at a likely upward trend shift.
💎Tron has been consistently adhering to a trading channel pattern. Its breakout above this channel recently indicates a potential ascent towards a resistance level, followed by an expected quick retraction, consistent with its typical trading behavior.
💎There's a notable probability of a bullish movement commencing from the support level around $0.098. With TRX having successfully emerged from the trading channel upwards, it's now eyeing resistance levels near $0.12.
💎Effective timing is crucial for savvy Paradisers. It's important to identify the optimal entry points during this upward movement, and it's advisable to be cautious about entering at the peak of the trend.
💎Exercise caution, as there's a possibility of TRX dropping below the support level of $0.094. A fall beneath this crucial mark could lead to questions regarding the continuation of the upward trend.

TRXUSDTBINANCE:TRXUSDT Long idea
⛔"Daily crypto market analyses I provide are personal opinions & not financial advice. Trading carries risks, so do your own research & seek advisor's help.#DYOR"
Don't forget to like and comment

TRX Ready for Parabolic Bullish Cycle ⬆BINANCE:TRXUSDT
Hi Traders, Investors and Speculators of the Charts 📈📉
Ev here. Been trading crypto since 2017 and later got into stocks. I have 3 board exams on financial markets and studied economics from a top tier university for a year.
After finally breaking out of triangular consolidation, TRON has confirmed a reversal after the bearish market and is starting a new bullish cycle. From the left we analyze the trend lines to get targets for the next bullrun and on the right we take a quick look at technical indicator CryptoCheck START V3.5 to confirm the bullish bias.
INCASE YOU MISSED IT : 👉 Another altcoin recently formed a bullish pattern:
_______________________
📢 Show us some LOVE 🧡 Follow for daily updates and trade ideas on Crypto , Stocks , Forex and Commodities 💎
We thank you for your support !
CryptoCheck

TRX/USDT: TRON Confirmed breakout for LONG tradeAs we can see from the chart, TRON has a clear breakout from its resistance. This is a good time to enter a LONG trade.
Entry Price: 0.104
StopLoss: 0.100
TP1: 0.1068
TP2: 0.1105
TP3: 0.1128
Like and follow us and share your thoughts in the comments.
Cheers
GreenCrypto
