Tron in 4 hour analysis, if we still bullish on bitcoinIf the bitcoin keep run with the actual buyers momentum, we will se Tron below 0.1 dollars
TRXUSDT trade ideas

TRX short positionyou can setup short position on TRX/USDT
OPEN: 0.08957
Target: 0.08880
LEV: 15X to 35X
Capital: 30% off all capital
OK?

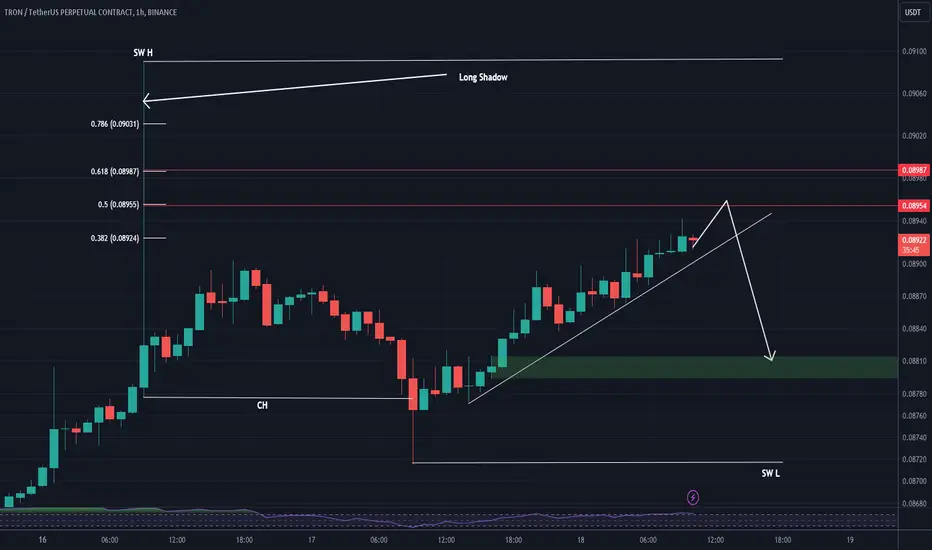
TRX can have a crash (has an educational point)TRX can have a crash
There is an educational tip here, pay close attention:
Educational tip: When we have long shoadow, the price tends to fill 50-60% of these shodows and then continue in the opposite direction. If a CH is in the opposite direction of the long shadow, we have more confirmation.
If more than 70% of the log is filled, it is possible to pass the log.
TRXTRX shows a bullish movement on the higher timeframe, that's why I am only looking for a long position. In this case, I am looking forward to move price like this BUT still a good bullish engulfing candle, then I will go for a limit order.

TRX (Crypto TRON ) Buy TF H1 TP = 0.0876On the H1 chart the trend started on October 13 (linear regression channel).
There is a high probability of profit taking. Possible take profit level is 0.0876
But we should not forget about SL = 0.0845
Using a trailing stop is also a good idea!
Please leave your feedback, your opinion. I am very interested in it. Thank you!
Good luck!
Regards, WeBelieveInTrading

Trxusdt with good setupRisk management is key book your profits when you making 1:3 and tn let it run for tp

TRXUSDTTRXUSDT is trading under the declining in descending parallel channel and break through Support and closed below this zone. now the price perfectly retest of broken level
Will the sellers attack again and send the price to 0.0830 level?
What you guys think of this idea ?

TRXUSDTHello snipers, nothing is impossible. In the one-day time frame, after hitting the upper line of the ascending channel, the price will decline to the bottom of the channel, in between there is a 103-day moving average that can provide good support and reverse the trend. All analyzes are only possibilities.

TRX: A bearish wave has already been confirmedTRX: A bearish wave has already been confirmed
During these days the price was moving down with very low volume and we can
see the final pattern was a type of triangle that was losing volume.
We have a minimum confirmation and this can push the price down this time.
Considering also the TRX price position it can be also an aggressive move as well.
Targets:
🎯 0.08300
🎯 0.08050
You may find more details on the chart!
Thank you and Good Luck!

Above 0.07679: Expected to create a new upward waveHello?
Hello traders!
If you "Follow" us, you can always get new information quickly.
Please also click “Boost”.
Have a good day.
-------------------------------------
Since we operate a stablecoin based on TRX, a drop in price can be a very dangerous warning.
Accordingly, it is one of the coins (tokens) that must be certain about how profits will be realized during trading.
In that sense, if it falls below 0.05378, it is necessary to check the movement of the stable coin (USDD).
(TRXUSDT chart)
If the price remains above 0.07679, it is expected to create a new wave.
(1W chart)
It is necessary to check whether the price can be maintained above 0.07725 and rise above 0.11964.
(1D chart)
Since it has fallen from a rising channel, I think it is highly likely that the current trend will continue until a new trend is created.
Since the StochRSI indicator is currently in the oversold zone, it is necessary to check at which point or zone it receives support or resistance when it leaves the oversold zone.
Accordingly, it is necessary to check whether it can quickly rise above 0.08867 or be supported around 0.08177.
-------------------------------------------------- -------------------------------------------
** All explanations are for reference only and do not guarantee profit or loss in investment.
** Trading volume is displayed as a candle body based on 10EMA.
How to display (in order from darkest to darkest)
More than 3 times the trading volume of 10EMA > 2.5 times > 2.0 times > 1.25 times > Trading volume below 10EMA
** Even if you know other people’s know-how, it takes a considerable amount of time to make it your own.
** This chart was created using my know-how.
---------------------------------

TRX going to lose the trend lineTRX going to lose the trend line after breaking the ylw zone we starting downtrend

TRXUSDTTRXUSDT is in bearish trend.
potentially printing LH and LL>
No sign of reversal here.
We buy at cmp because value at 0.382 fib num.
Price will retrace from here.

TRX - short positionHello my fellow traders, Tron chart looks like we could see a deviation above range high which could lead in break of trend line to the downside. TRX / BTC chart looks similar so I have a conviction that after price gets back in range we will see a continuation. At the moment trade is still more risky as we are above 0.084$. Watch for a break down.
Good luck.

🟩 TRXUSD - best crypto I can findThis is the best crypto coin that I can find.
VOLUME
On the bottom you are seeing only the above average volume weeks. We have the famous Wall of Blue (for the IBD students) and a classic VDU-voodoo (Volume Dry Up, for the Gilmo Students) on the right.
PATTERN
The Pattern printed is a typical VCP (for the Minervini students)
BASE CHARACTERISTICS
We have very strong positive week closes on the bottom of each contraction. Every week has closed +40% of its close range.
RELATIVE STRENGTH
The RS compared to ETH or BTC is off the chart!
If I am to buy any crypto this one looks like a real high probability setup

TRXUSDT BUY SETUPTRX potential making HNS PATTERN
you can buy now or buy limit
GoodLuck guys !
*Follow for more, free!
Like & comment
DYOR

TRX/USDT bullish momentum?? 👀 🚀 Tron Today Analysis💎Paradisers, gear up for a fantastic opportunity with TRXUSDT! We're currently observing it testing resistance levels and setting the stage for a bullish ascent👀
💎Right now, we're looking at two potential scenarios. First, if the price of TRX successfully breaches the resistance at $0.08459, expect a bullish surge. On the other hand, if selling pressure remains strong and the price fails to break through the resistance, we anticipate a retest of the support level at $0.08111, where a bullish continuation could occur.
💎Additionally, if the support level at $0.08111 is broken, consider planning a short entry in #Tron. In this case, your take-profit should be set at the next support level.
Keep your charts updated and Stay one step ahead of the market 🌴

TRON H1 2023 OverviewTRON is an open-source, public blockchain network designed for the creation and
deployment of decentralized applications (dApps) founded in 2017. TRON officially
became a decentralized autonomous organization (DAO) in Dec 2021, making it one of the
largest community-governed DAOs.
It employs a Delegated-Proof-of-Stake (DPoS) consensus mechanism, where 27 Super
Representatives are elected every six hours to maintain the network. TRON's Virtual
Machine (TVM), which uses "Energy & Bandwidth" instead of gas, allows affordable
execution of smart contracts and is compatible with Ethereum's Virtual Machine (EVM).
With a multi-layered architecture, TRON is recognized for its high transaction speed, low
cost, and hosts the largest circulating supply of stablecoin Tether (USDT).
Fundamentals and Performance
At the end of H1 2023, TRON’s block height exceeded 52.5 million. There were 7,385
nodes across the network, representing a 33.5% increase over H1.
In early April, the deployment of Stake 2.0 (TIP-467) on TRON’s mainnet was approved.
Stake 2.0 aims to bring greater flexibility to the TRON staking model, enhancing resource
utilization and system stability. It separates high-frequency resource delegation from low frequency staking operations, allowing resource re-delegation without unstaking and
improving resource management. By adding stake, delegate, and vote commands to the
TRON Virtual Machine (TVM), it expands use-cases and supports more applications.
Moreover, Stake 2.0 introduces a delay in unstaked TRX arrival to bolster the staking
model's stability and create a more predictable network for participants while removing
the 3-day non-voting period.
At the end of H1, TRX staked through Stake 2.0 accounted for 10.8% of the total stake,
benefiting from added support for Stake 2.0 by the likes of Trust Wallet, Gaurda Wallet,
NOW Wallet, and Via Wallet, among others.
For the full report click here .

TRX CAN FALL VERY SOON (1D)The structure of TRX in the daily and weekly time frame is the same as the previous analysis. The correction has started from the place where I have marked the red arrow. It means a big diametric!
But the trx went above the red box of the previous analysis and made a stop hunt.
I think we are at the end of wave F and we will have a fall for wave G.
In the red box, we are looking for a downward trigger to enter the sell/short position.
The green area is relatively strong support.
I specified the invalidation level, closing a daily candle above this level will violate the analysis
For risk management, please don't forget stop loss and capital management
When we reach the first target, save some profit and then change the stop to entry
Comment if you have any questions
Thank You

TRX trading planHorizontal supp/resis lines in yellow
2 ascending support lines
ascending RSI support line
Breakdown depends on BTC movement in terms of timeline

trend is bullish looking for the long entryH4 Support 0.07188 to 0.07279
H4 Resistance 0.09115 to 0.09439
H1 Support 0.08793 to 0.08831
H1 Resistance 0.08938 to 0.08988
the overall trend is up price has recently broken its H1 resistance level,
on retesting the previous resistance level, we can find the buy reason and take a long entry
target should be the resistance level of H4

TRXUSDTThis is a 1D frame analysis for TRXUSDT The price is fluctuating within the supply and resistance zone and if it fails to establish itself above the resistance line, we can expect a decrease in price. However, if it is able to establish itself above the supply and resistance zone, it can move towards its second resistance line. We expect the price to return to its support zone and, following a bullish pattern, move towards the resistance zones after it hits the support line and establishes itself above it. If it breaks and establishes itself below the line, it can start moving towards its next support line after a pullback.

TRX Crypto TRON Sell TP = 0.08602On the hour chart the trend started on Sept. 29 (linear regression channel).
There is a high probability of profit taking. Possible take profit level is 0.08602
But we should not forget about SL = 0.0899
Using a trailing stop is also a good idea!
Please leave your feedback, your opinion. I am very interested in it. Thank you!
Good luck!
Regards, WeBelieveInTrading

TRXUSD ❕ reached the resistanceRSI is in overbought zone on 4H and 1H Timeframes.
Price has formed a divergence.
TRX formed an inverted hammer (30m TF)
I expect a correction.
