TRON $TRX Takes an 8% nose-dive!His excellency Justin sun better not lose that $0.045 $TRX line of defense! TRON is generally not an asset to short due to its historical stability, but who knows what's on the plate this time around?
I believe it's still a great opportunity for longs but once you lose that red line, then it will get ugly ahead!
TRXUSDT trade ideas

🔥 TRX Bearish Triangle: Patience Is KeyOver the course of the last ~1.5 years, TRX has been forming a massive bearish triangle pattern . Bearish triangles classically break bearish , so that's what we're going to look at today. With TRX recently showing signs of reversing from the pattern's resistance, a bearish move is becoming more likely.
Wait for the break of the lowest purple support before scouting an entry.
Since the support has been holding for so long, a break of said support can lead to a massive sell-off because of all the stop-losses below it. Targets in blue.

TRXUSD ❕ above the liquidityThe Tron is trading above the range.
Price has fixed above 50EMA and 200EMA (4H TF).
I expect price to rise after fixing above the range.

TRXUSDTTRXUSDT Futures Setup:
Entry: 0.05419-0.05409 ✅
TP1: 0.05320
TP2: 0.05220
Note: Always use SL to avoid Liquidation.
Disclaimer: Trade at your own risk.


TRX - Range trend but positive momentumDuring the past weeks, TRX had a range trend but positive momentum. The price of Tron entered a correction after the bearish wave, which was able to stay at the support level of $0.053-$0.054 by breaking the downtrend line drawn in the previous analysis. Again, a positive reaction has been observed at this level, which indicates the attempt of buyers to grow the price to the resistance of $0.057 to $0.059. In general, the major resistance in daily time is considered in the range of $0.070. But in the 4-hour period, if the $0.059 resistance is broken, we can expect further growth and an upward trend. So, in general, for this week, the resistances of $0.059 and $0.062 can be short-term targets for buyers. You can also consider a narrow ascending channel for the price in the 4-hour timeframe. As long as the bottom of the channel is maintained in the orange range, we expect the price to grow.

TRXUSDT TECHNICAL ANALYSIS$TRX launched in June 2018 and TRON value was $0,052, last ATH was $0,178. Tron has been lost value lower than when first launched. We haven't got any BUY signals from our robo advisor/ indicator @EngineeringRobo yet in daily chart. But we have got our first buy signal with MA20&50 then MA50. Also, the candles are already breakout down trend-line plus one candle opened-closed completely above down trend-line. It may an opportunities for buy then we may earn first of all 5% then 10%.
Let's follow our chart closely and do not forgot the follow me.
"NFA""

💲Tron Ready To Strike Out💲💲Tron Ready To Strike Out.
💲After a perfect defense of the support zone set by the 0.382 level, we begin another attempt to attack northward.
💲Tron, in my opinion, has really great potential for growth.
💲It stands out very positively against the rest of the cryptocurrencies.
💲Looking at the technical environment, I do not have any doubts about the probability of the continuation of the increases.
💲In my opinion, it is more likely that the next few weeks will bring increases.
💲The scenario I am playing out is a continuation of the increases on TRX over the next few weeks. I don't exclude the possibility of changing the scenario if the market situation changes abruptly. I'm aware of the possibility of a correction at any time, this should be taken into account, If the outlook changes I will publish a post with an update, so I encourage you to actively follow the profile and read the description carefully.
🚀If you appreciate my work and effort put into this post then I encourage you to leave a like and give a follow on my profile.🚀

TRX potential big drop (mid-term analysis)Hi all,
As previously mentionned in the short-term analysis for TRX (cf link below), I would like to share my mid-term view on this crypto.
In 2D TF, we can see that selling pressure is increasing:
MFI values broke and were rejected by its long-term trendline
The same phenomena are confirmed with OBV
In lower TF (1H), the selling signal is triggered as shown in my previous post (link below).
This crypto is highly volatile, consider your risk management.

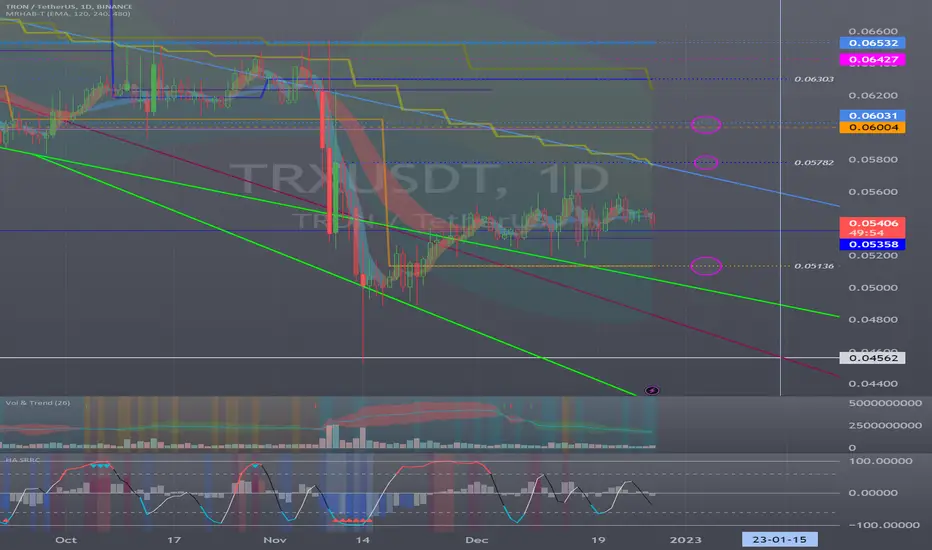
The 0.05358 point is stronger than any pointHello?
Traders, welcome.
If you "Follow", you can always get new information quickly.
Please also click "Boost".
Have a good day.
-------------------------------------
(TRXBTC 1W Chart)
It has risen in the section where the power of the rise is gained.
In order to release this force, we need to see if the price can sustain above 0.0000 0318.
-----------------------------------------
(TRXUSDT 1W chart)
The key is whether it can get support around 0.05358 and rise above 0.06004.
If not, a fall below 0.04562 is highly likely and you should think about how to counteract that.
(1D chart)
TRX is linked to USDD, a stablecoin.
Therefore, a drop in the price of TRX is likely to have a profound impact on the shape of TRX.
So, I think keeping the price above 0.05358 is of utmost importance.
Therefore, you have to work hard to ensure that USDD is pegged to $1.
Those who believe in TRX and continue their mid- to long-term investments should take advantage of this and take a trading method that increases the number of coins corresponding to profits while recovering the principal amount purchased.
The next volatility period is around January 15th.
-------------------------------------------------- -------------------------------------------
** All descriptions are for reference only and do not guarantee profit or loss in investment.
** If you share this chart, you can use the indicators normally.
** The MRHAB-T indicator includes indicators that indicate points of support and resistance.
** SR_R_C indicators are displayed as StochRSI (line), RSI (columns), and CCI (bgcolor).
** The CCI indicator is displayed in the overbought section (CCI > +100) and oversold section (CCI < -100).
(Short-term Stop Loss can be said to be a point where profit or loss can be preserved or additional entry can be made by split trading. This is a short-term investment perspective.)
---------------------------------
TRXUSD ❕ tests the rangeTrading volumes are low, but TRX is still moving above liquidity.
I believe that the asset may go lower to collect liquidity after a fixation in the range.

#Tron Bounces 12% from November Lows, TRX in a Bear FlagPast Performance of Tron
Tron prices are within a classic bear flag, adding 12 percent in a possible dead cat bounce. Overall, the TRX price formation is anchored by bears of early November since bulls are yet to reverse all losses. Traders can look to unload on every pullback higher but below $0.057.
#Tron Technical Analysis
TRX bulls appear to be in control, printing higher highs relative to the lower BB. Notably, prices are inside a rising channel. Even with this, TRX prices are higher, lifted by relatively low trading volumes, as the past six weeks of trading activity reveal. Therefore, if TRX is below $0.057 and inside the bear range set between November 8 and 14, the probability of the coin dropping further is high. Conservative traders can wait for a clear trend to form. Any gain above $0.057 may see TRX rise to $0.064 and November high is a welcomed bounce. Conversely, losses below $0.052 and December 20, below the lower trend line of the rising channel, will cancel this bullish outlook.
What to Expect of #TRX?
Buyers are upbeat, but prices are inside a bear flag. The leg up also has lower trading volumes, meaning sellers are still in control. Any break below the rising channel, allowing prices to sync with losses of December 20, could see TRX sell-off stiffly.
Resistance level to watch out for: $0.057
Support level to watch out for: $0.052
Disclaimer: Opinions expressed are not investment advice. Do your research.

TRXUSDT TECHNICAL ANALYSISTron $TRX has lost approximately 66% value since May 2021 till now. So many coin has lost over 90% and the TRON was trying to keep value stronger. We haven't got any buy signal from our robo advisor @EngineeringRobo yet but MA 20 & 50 has changed direction at the moment and it give us first buy signal. If the candle keep going stay green, first of all we may earn approximately 6% and our target might be our down trend-line. We are still on the bear market and if we use leverage, we may double our money.
Let's follow up our chart closely and do not forget to follow me.
"NFA"

trx viewpoin shortHi, dear traders. how are you ? Today we have a viewpoint to SELL/SHORT the trx symbol.
For risk management, please don't forget stop loss and capital management
When we reach the first target, save some profit and then change the stop to entry
Comment if you have any questions
Thank You


TRX approaching cluster resistance, be careful 👀last time we saw major rejection from this trendline, will history repeat or do we break it/.06 and have a nice bull move?
boost and follow to show support, thanks💙

TRXIdea: The price has formed many bearish divergences and signals. The color of the candles indicates the overbought zone. High probability of falling to 200 EMA

🔥 TRX Massive Bearish Triangle: Wait For BreakOver the course of the last ~1.5 years, TRX has been forming a massive bearish triangle pattern . Bearish triangles classically break bearish , so that's what we're going to look at today.
Wait for the break of the lowest purple support before scouting an entry.
Since the support has been holding for so long, a break of said support can lead to a massive sell-off because of all the stop-losses below it. Targets in blue.

$TRX, The rally before capitulation$TRX, Falling wedge with bullish divergence forming on the RSI, expecting bullish breakout enticing fresh liquidity only to realize harsh rejection to the downside from the measured. Expectation for final capitulation to follow alongside a prolonged accumulation phase.

Good opportunity on TrxusdtWe can see that it’s on 270 degree for gann cycles so it’s good area to get reflected at least 35% so try to not miss this one in this hard market

YongTung | TRX: Buy/Long TRX At Here, And Get Over 200% Profits!Hello traders, today I want to talk to you about TRXUSDT.
I made a few conclusions about TRON.
At the moment TRX price trades near to support line $0.04390 level (fibonacci 0.786 level).
I expect that price can make small correction to support line and then bounce up and start to rise.
Then, I think price can break resistance line and go higher.
I set up my first target locate at the local high and resistance level $0.09010 (blue line).
Also, I think price can break resistance level and continue move up until resistance zone.
Therefore I set up second target at $0.12895 level and $0.13457 level (fibonacci 0.618-0.66 zone).
This is my opinion, I really hope it will be useful for you.
This is an article not financial advice, always do your own research.
And please don't forget to support this idea with your like and comment, It means a lot to me, thanks.
Be prepared and save your money. Make big profits!

TRXusdt 3D important support zone Well in the chart we see the triangle pattern that is an important support range and with the complaint of this area, otherwise the line fails; The upward trend is formed.
Its not Buy or Sell SIGNAL
DYOR
BY : M.TeriZ - @AtonicShark

TRON (TRX) Price Prediction TRON (TRX) Price Prediction 2022
TRON (TRX) holds the 18th position on CoinGecko right now. TRX price prediction 2022 is explained below with a daily time frame.
The descending triangle is most commonly seen during downtrends and is often interpreted as a bearish signal. The ascending triangle pattern is reversed in the descending triangle pattern.
As the price continues to make lower highs, descending triangles indicate to investors and traders that sellers are more aggressive than buyers. When the price breaks out of the triangle in the direction of the overall trend, the pattern is complete.
Contrary to popular belief, a descending triangle can be bullish or bearish. A regular descending triangle pattern is traditionally regarded as a bearish chart pattern. A descending triangle pattern, on the other hand, can be bullish.
Currently, TRON (TRX) is in the range of $0.05379. If the pattern continues, the price of TRX might reach the resistance levels of $0.0909 and $0.2252. If the trend reverses, then the price of TRX may fall to $0.04634.
Happy Trading
