TRON looks like it wants to make a run northward!If Tron can breakout of the .1106 level, it might be able to run hard for a bit. It's above the 50 DMA and the 200 DMA on the 15 min chart as we speak.
TRXUSDT_1F7DF5 trade ideas

TRXUSDT - 4HIn the four-hour time frame, according to the strong downward momentum of the price movement and selling pressure in the market, if the range of 0.1065 units is broken and the price stabilizes below it, the price may fall to the range of 0.1040 and in the case of the strength of the range of 0.1025 units.
Otherwise, the possibility of price increase up to the range of 0.1110 units.

TRXUSDT.1DBased on the provided market data, the cryptocurrency TRX (Tron) is currently trading at $0.11 against USDT (Tether).
From a technical analysis perspective, the Relative Strength Index (RSI) for 4 hours, 1 day and 7 days are 55.83, 61.70, and 73.28 respectively. These values indicate that TRX is neither oversold nor overbought in the short term (4h), but it is approaching overbought territory in the daily (1d) and weekly (7d) charts. This could indicate a potential pullback in the future, but it also shows a strong upward momentum.
The Moving Average Convergence Divergence (MACD) for 4 hours, 1 day and 7 days are 0.00029, 0.0015, and 0.0082 respectively. The positive MACD value indicates an upward trend.
The Bollinger Bands (BB) values suggest that TRX is trading within a relatively stable range, with the potential for volatility based on the BB values for 4 hours, 1 day, and 7 days.
Looking at the support and resistance levels, the immediate support is at $0.10. If the price drops below this level, the next supports are at $0.098 and $0.095. On the upside, the immediate resistance is at $0.1177. If the price breaks this level, the next resistances are at $0.1244 and $0.1274.
Based on this analysis, TRX is showing signs of a strong bullish trend in the short term. However, as it is approaching overbought levels, there is a risk of a potential pullback. It would be advisable to watch the support and resistance levels closely for potential breakouts or rebounds. Please note that this analysis is based on the current market data and can change with market conditions. Always do your own research and consider your risk tolerance when investing in cryptocurrencies.

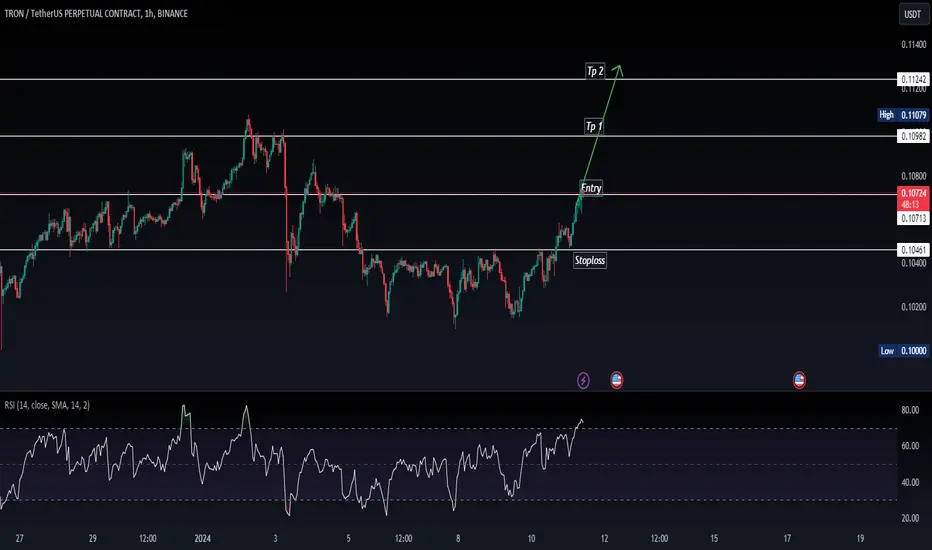
TRXUSDTmy entry on this trade idea is taken from a point of interest above an inducement.. I extended my stoploss area to cover for the whole swing as price can target the liquidity there before going as i anticipate.. just a trade idea, not financial advise

Technical Analysis of TRXUSDTDear traders and investors,
I would like to present a positive technical analysis for TRXUSDT, suggesting a bullish outlook based on current indicators.
Key Indicators:
Overall Trend: The overall trend for TRXUSDT remains upward, confirmed by multiple technical indicators.
Strong Support: Recent support levels have held robustly, indicating strong demand at specific price levels.
Moving Averages: Moving averages across different periods show signs of convergence, typically a positive indicator for the stability of the bullish trend.
Trading Volume: Trading volume has exhibited an increase during recent upward movements, suggesting growing interest from investors.
Points to Consider:
Potential Breakout: The price appears to be consolidating in a narrow range, indicating possible accumulation before a new upward push.
Possible Catalysts: Announcements of partnerships, development updates, or other TRX-related events could act as positive catalysts.
Technical Confirmation: Wait for confirmation of the bullish trend through signals such as reversal candles, moving average crossovers, or strength indicators.
Next Steps:
Close Monitoring: Keep a vigilant eye on price movements, trading volumes, and news announcements that could influence the market.
Risk Management: Implement appropriate risk management strategies, including the use of stop-loss orders, to protect your capital.
Market Updates: Stay informed about general cryptocurrency market developments, as they can impact TRXUSDT.
Conclusion:
Based on the current technical analysis, the outlook for TRXUSDT remains positive. However, keep in mind that markets are dynamic, and it's always wise to remain flexible in your approach.
As always, it is recommended to consult different sources of information and, if possible, seek professional advice before making significant decisions.
Best of luck in your trades!

TRXUSDTBINANCE:TRXUSDT analysis
I'm not interested right now but I'm looking for a short opportunity.
⛔"Daily crypto market analyses I provide are personal opinions & not financial advice. Trading carries risks, so do your own research & seek advisor's help. #DYOR
Don't forget to 🚀 and comment.

Signal again in high & low(TRX)❤️❤️Thanks for boosting 🚀 and supporting us!
📊 (Entry) : 0.10233(buy)- 0.10832(sell)
🔴 Stop Loss : 0.1(buy)- 0.11035(sell)
🎯 Take Profit : TP-1 = 0.10357 (TP-2 in entry reverse position)
🔗 For more communication with us, In the footnote and send a message in TradingView.
👨🎓 Experience and Education: Our trading team has five years of experience in financial markets, especially cryptocurrencies.

Tron sell Trx so hard but can 10% sell🔴 i think so. expect correction from this hard currency. Of course lovely


TRXUSDT - Bullish Divergence - Double bottomBINANCE:TRXUSDT has formed a double bottom after showing bullish divergence on the RSI. Expecting price to continue the bullish momentum!

Bullish opportunities in the Cryptosphere?DISCLAIMER: Trading Forex/Cryptocurrency involves risk and you may lose more money than you started with! These posts are not to be taken as financial advice and I offer NO guarantee that any of these ideas will result in profit. Also, trade ideas may change, depending on ever-changing market conditions. You are trading at your own risk and past performance is NOT indicative of future results. Please, know how much you are willing to risk on EVERY trade that you take and be SMART!
Simplify your trading. Always measure your risk and be okay with being wrong ; ) Wait patiently and get the price that you want. Use the market. Don't let the market use you!

Tron TRX aiming for 0.13 short termBullish pennant, break out, retest, go! I just put it out here to see how this turns out.

TRXUSDT # 00 ( Long Shut view of BULLISH rally !! )Hello dear traders .
Good days .
On monthly Bullish Gann Square , after pass 0.325 Gann Time zone , TRXUSDT start bullish rally . With long time collect spring TRX is ready for big bull run .
Road map is plotted with help of Gann Square and Gann Box .
Good luck and safe trades .
Thanks for your support and comments .

Tron(TRX) is ready to fallTron has reached and reacted to the extreme orderblock of the minor structure in the daily time frame.
We expect it to start downtrend and fall from this point.
The only way to faild this analysis is a candle closes above the extreme order block, which is also very unlikely.
This is my personal analysis and its not a financial advice.

Tron in a critical spot. Tron has formed a triangle that could be seen as an accumulation or maybe a distribution. An answer to this is waiting for a confirmation of price action.

TRXUSDT AnalysisLook carefully at this analysis. You quickly find out that the price moves in a fixed structure. This has to do with support and resistance. Recognizing the loss and gain of levels is very important. Learn to recognize this early. This way one gets a slight advantage over the rest.

TRX (Y24.P1.E1) Macro overviewHi traders,
We spoke about this recent level in our forum and the trading opportunity given,
Details below.
Here is my macro overview with Elliot wave count aligned with fibonacci.
The daily 200 moving averages are the key for the macro trend and its possible that we range here or keep going to the fib extension of 618 in the short period.
Enjoy.
Regards,
S.SAri
The setup
The results

Strategic Short-Term Play: Unveiling Trade Opportunity on TRXHello Traders,
I'm excited to share a trade opportunity based on a comprehensive technical analysis. The stochastic RSI, scrutinized across lengths 11, 51, and 101, along with the Traders Dynamic Index (TDI), signals a compelling entry point. Despite the trend going against the larger frame, meticulous analysis supports a short-term gain, with a conservative profit target set at 1.7. Let's seize this opportunity with calculated precision.
Happy Trading! with MEXC:TRXUSDT.P
will try to Implementing a Break-Even Point to Mitigate Risks and Maximize Gains.

#TRX/USDT LONG#TRX
The price is moving in a cross channel on a 1-day frame
Supported by price stability above moving average 100
It is expected that this descending channel will be broken upward
Current price is 0.10750
First goal 0.11078
Second goal 0.11466

TRX Tron Trading IdeaTRX Tron has the potential for another leg up. Still looking strong and from the point we started it went only 32.19% in total. I believe it can go even higher.

Tron (TRX): Rejected By 200 EMA + Bollinger BandsWe are looking at the TRX coin after seeing a very sharp rejection near 100/200 EMA and also on the upper side of Bollinger bands.
With that being said, after a nice breakdown of EMAs, we had one clean re-test, which was successful and seems to be pushing the price lower and lower.
We are looking for lower support to be reached one more time and potentially being broken as well!
Swallow Team

TRXUSDT.PTRXUSDT.P is in bullish trend.
Potentially printing HH and HL.
No sign of reversal here. Because trend is strongly bullish.
We didn,t wait for breakout we buy at CMP.
#7. TRXUSDT_2024-01-11_09-49-12learned sth new from my TA mentor!
still don't understand how this works, but I am having fun.
poorly drawn, but who cares!
Justin would be happy to see this.
I would buy
- 1st buy: $0.101
- 2nd buy: $0.095
