TRON Accumulation Phase Signals Potential for Explosive Growth TRON Accumulation Phase Signals Potential for Explosive Growth as On-Chain Metrics Point to Network Consolidation
The cryptocurrency market, a realm of perpetual motion and often bewildering volatility, occasionally presents moments of deceptive calm. These periods, far from indicating stagnation, can be the breeding grounds for significant future price movements. For TRON (TRX), a prominent blockchain platform known for its high throughput and focus on decentralizing the web, recent on-chain data and market behavior are increasingly pointing towards such a phase: a sustained period of accumulation, potentially heralding a major price surge as the network undergoes a subtle yet profound consolidation.
While the broader market narrative often chases fleeting trends and explosive, short-lived pumps, savvy investors understand the importance of identifying quieter, underlying currents. The concept of an accumulation phase, where smart money and long-term believers strategically build their positions, is a cornerstone of market cycle analysis. For TRON, the convergence of specific on-chain indicators – from whale activity and exchange flows to transaction patterns and staking metrics – suggests that such a phase is not just underway but is maturing, laying a robust foundation for a potential upward revaluation. This isn't about fleeting hype; it's about observing the methodical groundwork being laid for what could be a significant and sustained rally.
Understanding TRON: A Brief Overview of the Ecosystem
Before delving into the intricacies of its current market phase, it's essential to grasp what TRON represents. Launched by Justin Sun, TRON aims to build a decentralized internet. Its blockchain supports smart contracts, various kinds of blockchain systems, and decentralized applications (dApps). With its Delegated Proof-of-Stake (DPoS) consensus mechanism, TRON boasts high transaction speeds (TPS) and low transaction fees, positioning itself as a strong contender in the competitive Layer 1 landscape, particularly for applications requiring scalability, such as decentralized finance (DeFi), non-fungible tokens (NFTs), and GameFi.
The TRON network has cultivated a substantial ecosystem over the years. It hosts a significant volume of stablecoin transactions, particularly USDT, making it a key infrastructure layer for value transfer. Its TRC-20 token standard is widely adopted, and the platform has seen notable activity in dApp development and user engagement. This underlying utility and established presence are crucial, as accumulation phases are often rooted in a fundamental belief in the long-term viability and growth potential of an asset, rather than mere speculative fervor.
The Anatomy of an Accumulation Phase: Setting the Stage for a Breakout
An accumulation phase in financial markets is a period characterized by relatively flat or gradually inclining price action following a significant downtrend or a prolonged consolidation after an uptrend. During this time, informed investors, often referred to as "smart money" – which can include institutional players, large individual holders (whales), and project insiders – begin to quietly buy up the asset. Their strategy is to acquire substantial positions without causing a sharp price spike that would alert the broader market and increase their average entry cost.
Key characteristics of an accumulation phase include:
1. Reduced Volatility: Price swings tend to become less erratic as selling pressure from weaker hands subsides and buying pressure from accumulators absorbs supply.
2. Volume Signatures: While overall volume might appear subdued compared to peak bull market frenzy, there can be spikes in volume on minor price dips (as accumulators buy the lows) or during periods of sideways movement, indicating consistent buying.
3. Price Floor Formation: The price often establishes a strong support level, repeatedly bouncing off it as buyers step in to defend it.
4. Sentiment Shift: Public sentiment may range from bearish or indifferent (a hangover from a previous decline) to cautiously optimistic among those recognizing the underlying value. The rampant euphoria of a bull run is typically absent.
5. Duration: Accumulation phases can last for weeks, months, or even years, depending on the asset and the market cycle. The longer and more robust the accumulation, often the more powerful the subsequent markup phase.
For TRON, the suggestion of an accumulation phase implies that these sophisticated market participants perceive TRX as undervalued at its current levels and anticipate future catalysts or a broader market shift that will drive its price significantly higher.
Decoding TRON's On-Chain Signals: A Network Consolidating for Growth
On-chain data provides a transparent window into the activity occurring directly on a blockchain, offering insights that traditional technical analysis alone cannot capture. For TRON, several on-chain trends are converging to paint a picture of network consolidation and strategic accumulation.
• Whale Watching: The Giants Amass Their Holdings
One of the most telling signs of accumulation is the behavior of large wallet holders, or "whales." An increase in the number of addresses holding substantial amounts of TRX, or an increase in the balances of existing whale addresses, often indicates that those with significant capital are building positions. This can be observed by tracking the distribution of TRX tokens across different wallet tiers. If smaller retail wallets are shedding tokens (perhaps due to impatience or fear) while larger wallets are consistently adding to their stacks, it’s a classic sign of accumulation. These large players often have access to more in-depth research or a longer-term investment horizon, and their actions can be a leading indicator of future price strength. The quiet, steady absorption of TRX by these entities reduces the freely floating supply, making the asset more sensitive to future demand shocks.
• Exchange Dynamics: A Flight to Self-Custody
The flow of tokens to and from cryptocurrency exchanges is another critical on-chain metric. During accumulation phases, it's common to see a net outflow of the asset from exchanges to private wallets. This suggests that investors are acquiring tokens with the intention of holding them for the medium to long term (HODLing), rather than actively trading them. When tokens move off exchanges, it reduces the immediately available supply for sale, creating a supply squeeze that can exacerbate upward price movements when demand picks up. Conversely, large inflows to exchanges often signal intent to sell. If TRON is experiencing sustained periods where outflows significantly outweigh inflows, it strongly supports the accumulation thesis. This movement to self-custody also indicates a growing conviction among holders in the security and long-term prospects of their TRX investment.
• Staking and Supply Squeeze: Locking Up TRX
TRON's DPoS consensus mechanism involves staking, where TRX holders can lock up their tokens to participate in network governance and earn rewards. An increase in the amount of TRX being staked is a bullish indicator for several reasons. Firstly, it signals user confidence and engagement with the network. Secondly, and more directly relevant to price, staking removes tokens from the circulating supply. The more TRX that is staked, the less is available for trading on the open market. This reduction in liquid supply, similar to exchange outflows, can significantly amplify the impact of new buying pressure. If on-chain data shows a steady rise in the percentage of total TRX supply being staked, it contributes directly to the consolidation of supply and the potential for a more volatile upward move when demand surges.
• Transaction Patterns: Quality Over Quantity?
While high transaction volume can sometimes indicate strong network activity, during an accumulation phase, the nature of transactions can be more revealing than the sheer number. For instance, an increase in the average transaction size, even if the total number of transactions is stable or slightly decreasing, might suggest larger players are moving significant amounts of TRX, possibly consolidating them into fewer wallets or moving them to staking contracts. A decrease in "noise" transactions (very small, frequent transfers often associated with retail speculation or bot activity) coupled with an increase in larger, more deliberate transfers can be a sign of network maturation and consolidation by more substantial entities.
• Active Addresses and Network Growth:
While a surge in new active addresses is typically bullish, during a deep accumulation phase, the growth rate of new addresses might temporarily slow down as the market sheds speculative retail participants. However, the activity of existing addresses, particularly those identified as long-term holders or accumulators, becomes more critical. If these cohorts show increased activity in terms of receiving tokens or interacting with staking and DeFi protocols within the TRON ecosystem, it signals underlying strength and commitment, even if the headline number of daily new users isn't explosive. The consolidation here refers to a strengthening of the core user and holder base.
• Development Activity and Ecosystem Health:
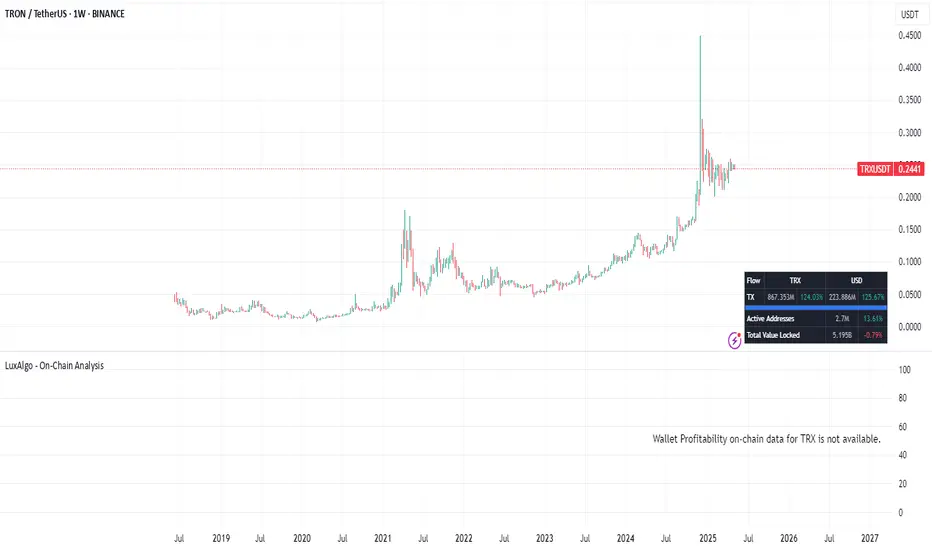
Beyond direct token movements, the underlying health and development activity of the TRON ecosystem play a crucial role in attracting long-term accumulators. Consistent updates to the TRON protocol, new partnerships, growth in its DeFi sector (e.g., JustLend, JustStables), expansion of its NFT marketplaces, and successful GameFi projects all contribute to the fundamental value proposition. On-chain data can sometimes reflect this through increased smart contract interactions or growth in Total Value Locked (TVL) within TRON's DeFi applications. Investors accumulating during this phase are often betting on this continued ecosystem growth translating into increased demand for TRX.
The Mechanics of a Price Surge Post-Accumulation: Coiling the Spring
Once an accumulation phase is sufficiently mature, the stage is set for a potential "markup" phase, where prices can rise significantly. This happens because the prolonged period of buying by strong hands has effectively absorbed most of the available sell-side liquidity. The "weak hands" – impatient or fearful sellers – have been flushed out.
With a reduced floating supply, even a moderate increase in demand can have an outsized impact on the price. This demand can come from several sources:
1. Breakout Traders: Technical traders who identify the end of the accumulation range and the beginning of an uptrend often jump in, adding to buying pressure.
2. Retail FOMO (Fear Of Missing Out): As the price starts to move decisively upwards and breaks key resistance levels, it attracts attention from the broader retail market, leading to a fresh wave of buying.
3. Positive News Catalysts: Fundamental developments, such as major partnership announcements, technological breakthroughs, or favorable regulatory news, can act as triggers, igniting the demand that the accumulated supply cannot easily meet.
The price action during a markup phase is often characterized by a series of upward impulses, followed by brief consolidations or pullbacks, before the next leg higher. The strength and duration of this surge are often proportional to the length and thoroughness of the preceding accumulation. A well-established accumulation base acts like a coiled spring, storing potential energy that is released during the markup.
Catalysts Beyond Consolidation: What Could Ignite TRON's Rally?
While the on-chain evidence of accumulation and network consolidation provides a strong foundation, several external and ecosystem-specific catalysts could ignite the anticipated price surge for TRON:
1. Broader Crypto Market Bull Run: TRON, like most altcoins, is significantly influenced by the overall sentiment and price action of Bitcoin and the wider cryptocurrency market. A sustained bull market led by Bitcoin would likely lift all boats, providing a favorable tailwind for TRX to realize the potential built up during its accumulation.
2. Major Ecosystem Developments: Significant advancements within the TRON ecosystem could be powerful catalysts. This could include the launch of a highly anticipated dApp, a major upgrade to the TRON protocol enhancing its scalability or functionality (like advancements in its Layer 2 solutions or cross-chain capabilities), or a surge in adoption of its existing DeFi or NFT platforms.
3. Strategic Partnerships and Integrations: New, high-profile partnerships with established companies or integrations with other popular blockchain networks or traditional finance (TradFi) players could significantly boost TRON's credibility and utility, attracting new users and investors.
4. Increased Stablecoin Dominance: TRON is already a major player in stablecoin transactions. Further growth in this area, particularly if it captures more market share or integrates new, popular stablecoins, would solidify its role as a key financial infrastructure and drive demand for TRX for transaction fees and network participation.
5. Regulatory Clarity: Positive regulatory developments in key jurisdictions that provide greater clarity and legitimacy for cryptocurrencies, including TRON, could unlock institutional investment and broader retail adoption.
6. Justin Sun's Influence: While sometimes controversial, Justin Sun remains a highly influential figure in the crypto space. Strategic announcements or initiatives led by him can often generate significant market interest and speculative buying for TRON.
7. Narrative Shifts: The crypto market is often driven by narratives. If a narrative around high-throughput, low-cost Layer 1s for dApps and stablecoin transfers regains prominence, TRON is well-positioned to benefit.
Navigating the Waters: Considerations and Potential Headwinds
While the signs of accumulation and potential for a price surge are compelling, it's crucial to approach the market with a balanced perspective and acknowledge potential risks:
1. Duration of Accumulation: Accumulation phases can be protracted. There's no guarantee of an immediate breakout, and patience is often required.
2. False Breakouts ("Springs" or "Shakeouts"): Markets can experience false breakouts below the accumulation range to shake out remaining weak hands before the true markup begins. Similarly, initial moves upward can sometimes fail and fall back into the range.
3. Market Manipulation: While on-chain data offers transparency, sophisticated actors can still attempt to manipulate sentiment or price in the short term.
4. Overall Market Conditions: A severe downturn in the broader cryptocurrency market or global macroeconomic headwinds could delay or dampen any potential TRON-specific rally, regardless of its strong accumulation pattern.
5. Competition: The Layer 1 blockchain space is fiercely competitive. TRON faces ongoing competition from numerous other platforms, and its ability to maintain and grow its market share is critical.
6. Regulatory Risks: The regulatory landscape for cryptocurrencies remains uncertain in many parts of the world. Adverse regulatory actions could negatively impact TRON and the broader market.
Conclusion: Is TRON Coiling for a Major Move?
The confluence of on-chain indicators – from the subtle yet persistent buying by large holders and the movement of TRX off exchanges to the increasing amount of staked tokens and the underlying consolidation of network activity – paints a compelling picture. TRON appears to be in a classic accumulation phase, a period where the groundwork is meticulously laid for future growth. This isn't the frenetic energy of a market peak, but rather the quiet confidence of informed capital positioning itself for what it anticipates will be a significant upward revaluation.
The network consolidation suggests a strengthening of TRON's core, a pruning of speculative froth, and a concentration of its native token, TRX, into the hands of those with a longer-term conviction. While no outcome in the cryptocurrency market is guaranteed, and risks always persist, the current on-chain trends for TRON are undeniably bullish from a structural perspective.
If this accumulation phase completes successfully and is met with favorable market conditions or specific catalysts within the TRON ecosystem, the subsequent price surge could be substantial. The "coiled spring" analogy is apt; the longer and deeper the compression during accumulation, the more explosive the release can be. For investors and market observers closely watching TRON, the current period of apparent quietude might very well be the deceptive calm before a significant storm of buying pressure and a powerful move upwards, reaffirming the age-old market wisdom that fortunes are often built not in the frenzy of the bull run, but in the patient, strategic accumulation that precedes it. The signs suggest TRON's engines are being primed; the question is not if, but when, they will fully ignite.
TRXUSDT_1F7DF5 trade ideas
Trx long to $0.25441Trx was consolidating for a bit but recently showed signs that its likely to breakout to the upside. I took aposition here
Stop: $0.24551
Target: $0.25441
Dtt strategy applied

TRX/USDT – Bullish Momentum Valid While Holding Above 0.2TRON recently broke market structure to the upside, which confirms a potential shift out of the long-term accumulation range. This bullish break is technically supported by several elements that suggest continuation, as long as price action respects key levels.
Price is currently:
Above the Ichimoku cloud, with Span A at $0.2473 and Span B at $0.2404, which confirms the directional bias is shifting in favor of the bulls.
Above the Point of Control (POC) of the entire accumulation range, it is now trading where the highest traded volume occurred — a strong base for further expansion.
The Trend Strength Index (TSI 20) is turning positive (0.22), showing the beginning of a momentum shift. Meanwhile, TSI 10 is at -0.13, suggesting short-term momentum is still neutral or cooling, which aligns with the idea of a possible pullback before continuation.
Scenarios to Watch:
Optimal Entry (Pullback):
The zone between $0.2248 and $0.2009 is an important support level where price has previously reacted and where resistance was once found. This structural shift from resistance to support adds significance to the area. Even though it is currently below the Ichimoku cloud, the price's historical behavior makes it a key zone to watch for potential bullish entries during a pullback.
Breakout Confirmation:
A clean break and close above $0.2597 (previous swing high) would confirm bullish continuation.
A retest of $0.2597 following a breakout would provide a secondary entry opportunity.
Upside Target:
The projected move points to $0.44, based on the measured range expansion from the breakout, which also coincides with the next major resistance area.
Trade Setup Summary:
Buy Zone 1: $0.2248 – $0.2009
Buy Zone 2 (break and retest): Above $0.2597
Target: $0.44
Invalidation: Close below $0.2000
Trend Bias: Bullish while above $0.2000
TRON remains one of the most active Layer 1 blockchains in terms of daily transactions and stablecoin usage, especially USDT transfers. While it doesn't enjoy the same spotlight as Ethereum or Solana, TRON has been quietly expanding its DeFi ecosystem and maintaining strong on-chain activity. Recently, its growing integration with BitTorrent and cross-chain interoperability initiatives have boosted sentiment. Additionally, the recent stabilization of broader market conditions increases the likelihood that breakout plays like TRX can attract renewed capital rotation during altcoin cycles.
Disclaimer: This content is for educational and informational purposes only. It does not represent financial advice or a recommendation to buy or sell any financial instrument. Trading involves risk, and you should only trade with money you can afford to lose.

TRX setting up a FOMO Scenario on DailyIs Justin Sun setting us up for FOMO with TRX? Daily is accumulating. is it for an explosion up, or down? I have no additional information than what's portrayed in the picture. Plenty of room for MFI, break out is another tap of the upper BB Band, and momentum is clearly ready to just go up. my guess is this is a breakout trade already started but who knows. So hard to tell and our boy Justin S can stay way more solvent then you can and way longer. he can keep prices down for years if he wanted to. But, I like our chances here. SL would be a bottom bb band touch before an upper band touch. this is a spot only trade. If break out is up, people will FOMO this and they may not be wrong.

Lingrid | TRXUSDT broke CONSOLIDATION zone. Potential LongThe price perfectly fulfilled my last idea . It hit the target level. BINANCE:TRXUSDT market has decisively broken through the 0.2500 psychological level and consolidation zone with an impulse leg. Additionally, it has broken through the downward trendline, confirming the strength of this move. On the higher timeframe, the market is forming an ABC pattern, suggesting that price may reach the resistance zone around 0.2780. I expect a pullback in the near term, which would likely present a buying opportunity, followed by continuation of the bullish trend. My goal is resistance zone around 0.2595
Traders, if you liked this idea or if you have your own opinion about it, write in the comments. I will be glad 👩💻

TRX/USDTThe coin has a macro bullish structure. After a correction, it’s been in accumulation for 127 days. Upside targets are 0.33–0.44

Tron Eternal Uptrend ContinuesThis is good news for the overall market. Tron continues to grow.
If we give a closer look to this chart, we can notice a rounded/cup pattern developing after the last correction and this is a strongly bullish development.
The action is moving above the base (blue line) of the pattern and this is what makes this chart structure super bullish.
Support was found also on the middle trendline of the long-term rising channel. The uptrend that has been present since November 2022.
TRXUSDT is set to continue growing long-term.
It is true that Tron is its own economy and has a real working product, or else the chart wouldn't look like this. A chart like this says that something positive is happening behind the scenes. All conditions for this trading pair and Cryptocurrency project continue to be green.
Namaste.


TRX USDT LONG TRADE SETUPTRX is currently holding at a strong support level , with a high probability of a bounce. Additionally, other indicators, such as the 200 EMA, are also acting as support . There is a high chance of it moving upwards.

Tron Potential DownsidesBINANCE:TRXUSDT
Hey Traders, in today's trading session we are monitoring Tron for a selling opportunity around 0.25 zone, Tron is trading in a downtrend and currently is in a correction phase in which it is approaching the trend at 0.25 support and resistance area.
Trade safe, Joe.

TRXUSDT TRXUSDT Price Action Analysis (1H Timeframe)
🔹 Overall Trend: After a strong rally, the price is in a correction phase, currently trading at 0.2291. The key resistance at 0.2300 must be broken for a bullish continuation.
🔹 Bullish Scenario:
A breakout above 0.2300 with confirmation could push the price towards 0.2345 and 0.2435.
If this happens, the bearish structure will be invalidated, increasing bullish momentum.
🔹 Bearish Scenario:
Failure to break 0.2300 may lead to a pullback towards 0.2250 and 0.2205.
Losing 0.2205 could open the way for a deeper drop to 0.2160, a critical support zone.
🎯 Conclusion: Watch key levels closely; a confirmed breakout above 0.2300 signals a buy opportunity, while losing 0.2250 strengthens the bearish outlook.

Lingrid | TRXUSDT bullish STRUCTURE with Potential ENTRY Zone The price perfectly fulfilled my last idea . It hit the target level. BINANCE:TRXUSDT is showing a strong bullish momentum making higher lows and higher highs. On the daily timeframe, the market is rolling back after forming higher highs. There's a possibility that the price might pull back toward the support level, dipping below the psychological round number at 0.240. I think if the price rejects the upward trendline, weekly high and support level there is great chance of trend continuation. This correction might provide an opportunity for buyers to enter, with the potential for the price to retest the recent higher high level afterwards. 📈 Keep an eye on these key levels for optimal entry points. My goal is resistance zone around 0.2530
Traders, if you liked this idea or if you have your own opinion about it, write in the comments. I will be glad 👩💻

TRXUSDT (TRON) End of correction and Bullish Starting PointBased on the presented chart, it is observed that TRON is undergoing a corrective phase. This correction may extend to the level of 0.2421. It is anticipated that after reaching this level, a new upward trend in TRON's movement will commence

Tron (TRX): Possible Smaller Correction To Lower Zones Tron coin has recently filled the bullish CME gap with a decent liquidity-hunting candle, where now we see the dominance is back in the hands of sellers.
We have put 2 points of interest zones for us where we will be looking for some kind of re-test to happen before another movement to upper zones.
Swallow Team

TRXUSDT TRON $TRX #bullish #breakingout #trend #longbaseIn a tough market after a sideways movement, it has broken out. If it kicks on from here, it will run to 0.30 imo. Time to add on and scale with conviction.

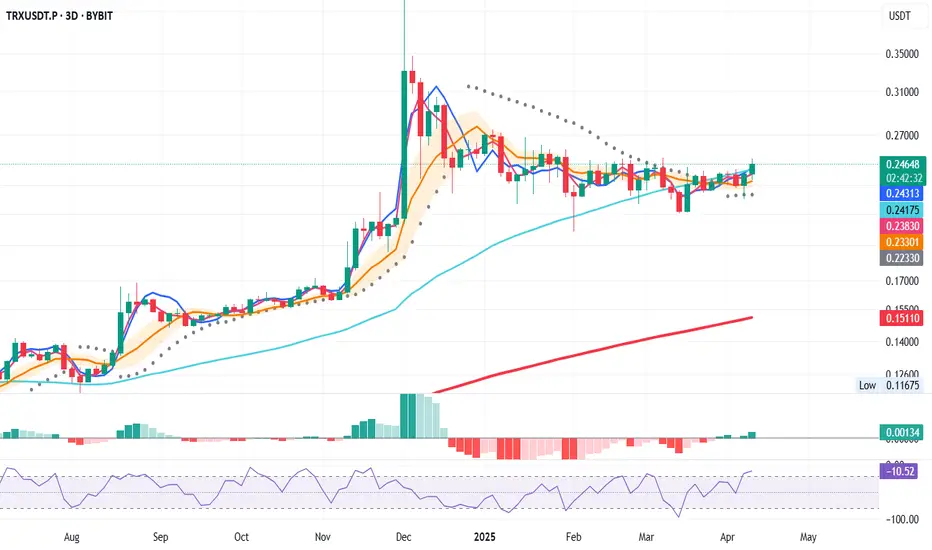
TRXUSDT – Bullish System Trigger (3D Chart)
📅 April 13, 2025
Today’s 3D bar close offers a strong bullish signal, aligning multiple system indicators in favor of a long entry.
Here’s what the system confirms:
✅ Price closed above the 50 MA – bullish structure
✅ MLR > SMA > BB Center – solid confluence
✅ Price > PSAR – trend shift confirmed
✅ Above the 200 MA – long-term trend support
Entry Strategy
- Open long at the 3D bar close
- Stop-loss below the latest PSAR dot for system integrity
📌 Note: This is a system-based entry — not a prediction.
TRXUSDT Eyes Breakout Amid Bullish StructureThe TRXUSDT market appears to be forming an ABC extension pattern, characterized by a series of higher lows, while the highs remain relatively flat. The price has been consistently testing the 0.2400 resistance area, indicating the possibility of a breakout and a sustained move above this level. Recently, the price surpassed the previous week's high, which may signal either a short-term pullback or continued upward momentum. A retest of the support zone is anticipated before the market potentially resumes its upward trend. The next key resistance level is projected around the 0.2500 mark

Lingrid | TRXUSDT short-term BULLISH move in CONSOLIDATION zoneThe price perfectly fulfilled my last idea . It reached the target level. BINANCE:TRXUSDT market is forming an ABC extension pattern and has established higher lows, while the highs remain relatively equal. Price continues to test the 0.2400 resistance zone, and I anticipate a potential breakthrough and close above this level. Recently, price broke above the previous week's high, suggesting it may either pull back or continue moving upward. However, I expect price to retest the support zone before resuming its upward trajectory. My target is resistance zone around 0.2500
Traders, if you liked this idea or if you have your own opinion about it, write in the comments. I will be glad 👩💻

TRX iHVF 12HTRX setting up for a iHVF to 0.1810. 8.5 RRR. Exit pump considering macro environment. Stop loss at assumed second impulse low (high). Target from first impulse draw brought to second impulse low (high), potential for over/under performance.

Be careful with TRX !!!As you can see, the price has now formed an ascending wedge , which is promising. The price could rise to $0.27 after breaking this wedge...
Give me some energy !!
✨We spend hours finding potential opportunities and writing useful ideas, we would be happy if you support us.
Best regards CobraVanguard.💚
_ _ _ _ __ _ _ _ _ _ _ _ _ _ _ _ _ _ _ _ _ _ _ _ _ _ _ _ _ _ _ _
✅Thank you, and for more ideas, hit ❤️Like❤️ and 🌟Follow🌟!
⚠️Things can change...
The markets are always changing and even with all these signals, the market changes tend to be strong and fast!!

Liquidity Grab Ahead? Why TRX (Tron) May Retrace Soon TRX (Tron) is currently trading near a significant resistance zone, aligning with the upper boundary of a descending channel on the 4-hour timeframe 📉. This area is likely to hold liquidity in the form of buy stops resting above the previous range highs. Given the broader downtrend and the strong resistance overhead, the price may retrace as it taps into this liquidity pool.
This setup presents a compelling short opportunity, with the expectation that TRX will reject this level and move lower, targeting support zones below. Traders should remain cautious and monitor price action closely for confirmation before entering a position ⚠️.
Disclaimer: This analysis is for informational purposes only and does not constitute financial advice. Cryptocurrency trading involves significant risk, and you should consult with a financial advisor before making any investment decisions. Always trade responsibly! 🚨

TRXUSDT Breakout detected, Accumulate!!Join our community and start your crypto journey today for:
In-depth market analysis
Accurate trade setups
Early access to trending altcoins
Life-changing profit potential
Let's analyze TRXUSDT:
TRX has broken out after prolonged consolidation, signaling strong potential. Fundamentally and technically, TRX appears robust. An ascending triangle breakout suggests bullish momentum. Accumulate TRX now to capitalize on this upward trend. This breakout indicates a significant price movement is likely.
Resistance zone: $0.2540- $0.2614
Target 1: $0.2735
Target 2: $0.3010
Target 3: $0.3391
If you find this analysis helpful, please hit the like button to support my content! Share your thoughts in the comments, and feel free to request any specific chart analysis you’d like to see.

TRXUSDT 1D LONG [UPdate]In line with the expectations I outlined in my main TRXUSDT 1D LONG review the price interacted perfectly with the key liquidity block and turned around confidently.
To feel safe in this position, I move the stop order to breakeven and continue to wait for my targets to be reached!
Targets:
$0.2509
$0.2580
$0.2679
$0.2815
