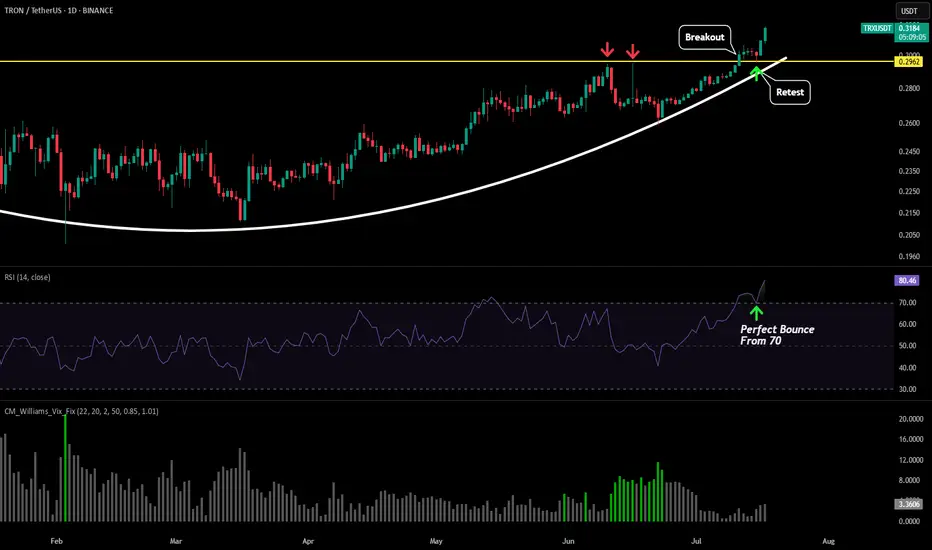
TRX - BreakoutRecently TRX brokeout from its resistance level (yellow line) and is skyrocketing to the upside. The technical move for this move is $0.43-$0.45.
Last time we were around these price levels we saw an almost 100% daily candle so it could shoot up there really quickly. A break back below the yellow
About TRXUSDT_26B410
Related DEX pairs

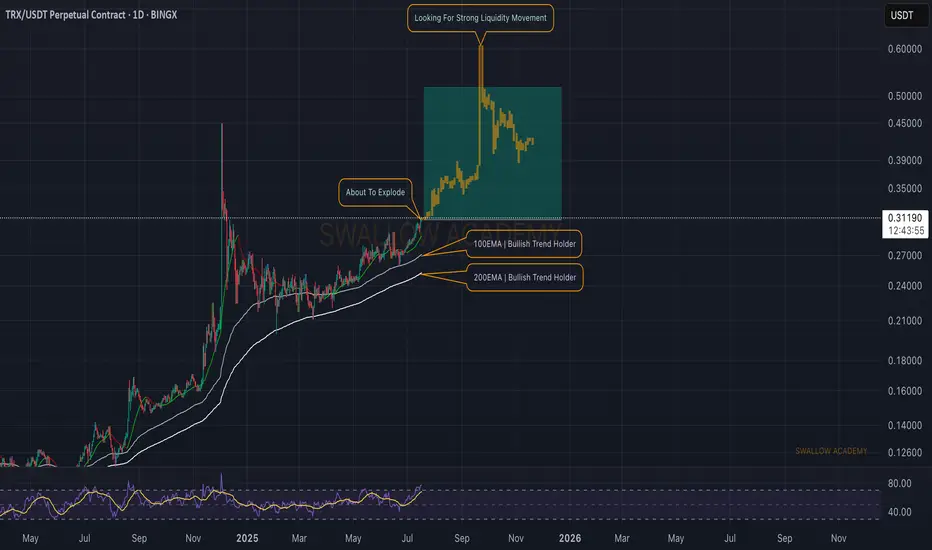
Tron (TRX): We Are About To Explode | Easy Trade To TakeTron is about to explode. We have been talking for a very long time about it, and since then we have had a decent upward movement, but this is nothing compared to what we are expecting from TRX.
Looking for at least +50% movement from here.
Swallow Academy
TRX Approaching Cup Breakout – Market Decision Imminent
TRX/USDT – Daily Chart Analysis
TRX is shaping a textbook Cup Pattern on the daily timeframe — a strong bullish continuation signal if confirmed. Price has gradually curved upward, and we are now testing the key resistance area at 0.29–0.30.
📌 Key Scenarios:
🔹 Bullish Breakout Scenario:
A confirm


DeGRAM | TRXUSD reached the resistance line📊 Technical Analysis
● TRX is grinding the channel top (≈ 0.288-0.290) while printing a narrowing rising-wedge; momentum is fading as each thrust stalls just below the June trend-line.
● A decisive break beneath 0.285 would invalidate the wedge and hand control to sellers, opening 0.279 (mid-band)

TRX USDT SHORT TRADE SETUPTRX/USDT is currently holding at a strong resistance zone, with a high probability of an downward price move. Also EMA 200 acting as a magnet to pull price downward for TRX.

Free signals: today (TRX)hello friends✋️
Considering the drop we had, you can see that the price was well supported in the specified area and buyers came in. Now in the return of the price, we can buy step by step in the specified support areas and move with it until the specified goals, of course, with the management of s

TRX - Double signal short Wyckoff Up-Trust + PRS Reading the chart (annotations in sync with chat):
1. Largest Up volume wave
3. Resistance Level coming from Daily chart
3. Fast Up Wave (could be fake)
4. Placed AVWAP on fast wave and
5. Our Entry: Double Plutus signal after the retracement Wyckoff Up- Trhust + PRL
Enjoy reading the waves , sp

TRX - Getting Out with a small LossIt seems that some sellers came in before resistance level. I am sure sure about the outcome so I am getting out with a small loss

See all ideas
Summarizing what the indicators are suggesting.
Oscillators
Neutral
SellBuy
Strong sellStrong buy
Strong sellSellNeutralBuyStrong buy
Oscillators
Neutral
SellBuy
Strong sellStrong buy
Strong sellSellNeutralBuyStrong buy
Summary
Neutral
SellBuy
Strong sellStrong buy
Strong sellSellNeutralBuyStrong buy
Summary
Neutral
SellBuy
Strong sellStrong buy
Strong sellSellNeutralBuyStrong buy
Summary
Neutral
SellBuy
Strong sellStrong buy
Strong sellSellNeutralBuyStrong buy
Moving Averages
Neutral
SellBuy
Strong sellStrong buy
Strong sellSellNeutralBuyStrong buy
Moving Averages
Neutral
SellBuy
Strong sellStrong buy
Strong sellSellNeutralBuyStrong buy