TREND ANALYSIS OF TRON-15MConsidering that the currency trend is downward in the 4H time frame and is at a good level that also crosses the trading node, we can enter in the 15M time frame due to the decrease in momentum after the LWP is broken and with the limit Let's have a loss of 1% risk to reward 3. TP1 is equal to the loss limit.
TRXUSDT_26B410 trade ideas

TRON -15MDue to the decrease in momentum, you can enter the trade after the LWP is broken, and considering the loss limit of 1%, you can expect a risk to reward of 3.

TRX's Next Bull Run Will Melt FacesTRX has never held this strong compared to other bull runs. It's printed an interesting 3-year old bull flag. And if the price holds well above and retests with conviction, we could see the start of an impulsive wave next.
TRX has historically been the punching bag of negative sentiment in crypto and that is changing. Justin Sun has recently embraced his bias and has gone fully decisive with the introduction of the offshore Chinese Yuan (CNH) support and going as far as touting its strength vs $USD.
I put my TP for the next bull run. The price puts TRX at a MC of $128B or 10x its MC from the previous ATH. 10x is in my opinion a conservative figure in crypto.
If there will be a blow off top then TP2 is it IMO.
Not Financial Advice

TRXUSDT 1W BULLISHTRX is at the base of the bullish channel, with the previous top having broken as support, with Stochastic oversold, above the 80-period exponential moving average.
Potential of 50% appreciation.

I am buying some TRX at this level I am buying some TRX at this level .
Rd + in 4h and 1h and daily time frame .

TRX already create the Inverse cup and handle pattern TRX already create the Inverse cup and handle pattern and looking bearish.
Stay awesome my friends.
_ _ _ _ _ _ _ _ _ _ _ _ _ _ _ _ _ _ _ _ _ _ _ _ _ _ _ _ _ _ _ _ _
✅Thank you, and for more ideas, hit ❤️Like❤️ and 🌟Follow🌟!
⚠️Things can change...
The markets are always changing and even with all these signals, the market changes tend to be strong and fast!!

Strong Daily S/R (Support / Resistance) Level for TRX In conjunction with the Stocahstic RSI Oscilator, here seems a bounce up.

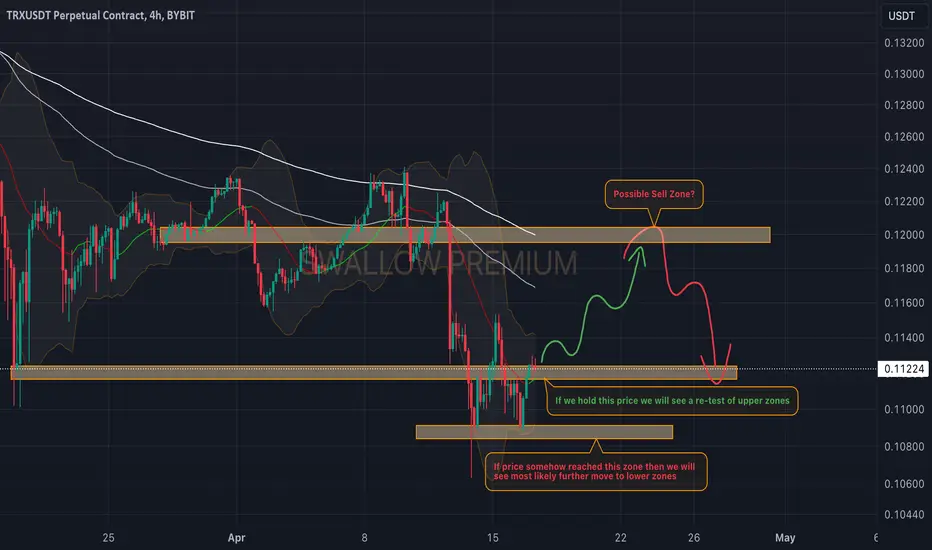
Tron(TRX): Interesting / Will We Drop More? / Will We Pump More?Tron has had a nice, small recovery phase after that drop recently.
We are looking here for further recovery to the upper zones (towards EMAs), and from there we will be looking for a possible short position!
If we fail to maintain the current zone and move to a lower liquidity zone, then we will be looking for an early, short setup!
Swallow Team
TRX/USDT assessing key support? 👀🚀TRON analysis💎 Attention, Paradisers! Keep a close eye on #TRXUSDT. It’s currently showing a promising upward trend from a critical support zone at $0.10921.
💎 Historically, #TRON has adhered to a descending channel pattern, consistently forming lower lows and lower highs. Right now, it’s positioned at a crucial support level of $0.10921. If the price maintains its momentum here, we could be on the verge of a significant bullish surge.
💎 As prudent traders, we need to be prepared for various scenarios. While a bullish rebound from a lower support level at $0.10017 remains a possibility, dipping below this level could trigger a marked bearish downturn.
💎 Stay adaptable with your strategies and make well-informed decisions, Ladies and Gentlemen of ParadiseClub. Your ParadiseTeam is diligently monitoring the market to navigate these opportunities effectively.
MyCryptoParadise
iFeel the success🌴

✴️ Tron 6X SHORT (256% Potential)When will you give up?
What type of question is that?
Trading is a job!
Writing is a job!
Trading, writing, fighting, living is work; it is my job.
When will you give up on raising your family?
When will you give up on live?
Never I suppose and that's great.
We are not meant to give up.
We are not supposed to give up.
We are meant to live it up!
Stand up, wake up and forge ahead.
I this off-topic?
Nope! I am sharing my spirit with you so that it can guide when the hard times come. So that it can be of your support when things don't go our way.
Trading is hard and so is life, it is full of joy but also pain.
If we don't find the strength we can give up and we tend to give up right before meeting success.
Never give up!
Better yet, learn from mistakes.
Here you have my numbers for another trade.
Tron has been moving straight up since November 2022 and now is producing the first week red.
Early signal? Of course, some people like early while others like late.
Consider the risk or not, that's your problem... I am wishing you success.
_____
SHORT TRXUSDT
Leverage: 6X
Buy-in: 0.14444 - 0.13100 | Cp: 0.13600
Targets:
1) 0.12950
2) 0.12090
3) 0.10700
4) 0.09780
5) 0.08780
6) 0.07800
Stop-loss: Close daily above 0.15500
Potential profits: 256%
Capital allocation: 3%
_____
Thank you for reading.
Your support is continually appreciated.
Namaste.

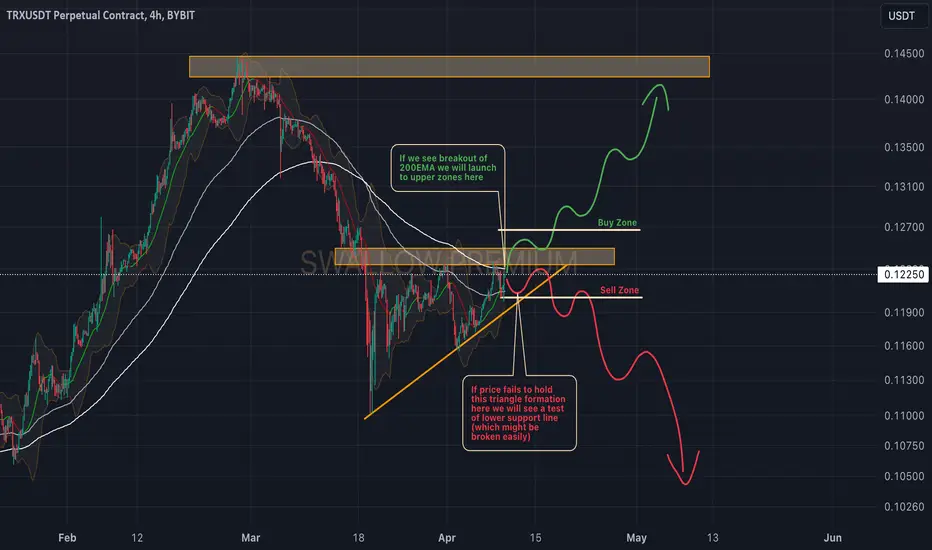
Tron(TRX): About To Explode!Tron is left in the 50/50 position, where as of now we see a price hovering below 200EMA, which seems to be one of the major zones to hold the price (while also we have been building up a nice higher low on the triangle formation).
With that being said, we are looking for further confirmations, but the setups that we look into are shown. Now all we have to do is keep an eye on that smaller trend and the 200 EMA line and wait.
Swallow Team
Tron Trx usdt analysis
Time frame daily
Bace on green uptrend
Risk rewards ratio >3
First target 15 cent (0.15$)

TRX Tron Technical Analysis and Trade Idea PLUS My Trading Plan In this video, we delve into a comprehensive technical analysis and trading concept for TRX (Tron). Our assessment reveals a potential trade opportunity. We meticulously analyze the current price action, closely scrutinize market structure, and incorporate market dynamics. Based on favorable conditions, we identify a potential entry point. However, it is crucial to underscore the significance of implementing robust risk management strategies. Please note that this video is purely educational and should not be construed as financial advice.

🚩TRX can Go Down By Bearish Pennant Pattern🚩🏃♂️ TRX is moving in the 🔴 Heavy Resistance zone($0.150-$0.122) 🔴 and Ascending Channel .
📈Also, TRX has managed to form two Classic Patterns ; the first pattern is the Rising Wedge Pattern , and the second pattern is the Bearish Pennant Pattern .
🔔Currently, TRX has managed to break the bottom line of the Rising Wedge Pattern, and I expect TRX to continue its decline , at least to the lower line of the ascending channel .
❗️⚠️Note⚠️❗️: An important point you should always remember is capital management and lack of greed.
TRON Analyze ( TRXUSDT), 4-hour time frame ⏰.
Do not forget to put Stop loss for your positions (For every position you want to open).
Please follow your strategy; this is just my Idea, and I will gladly see your ideas in this post.
Please do not forget the ✅' like '✅ button 🙏😊 & Share it with your friends; thanks, and Trade safe.


#TRX/USDT#TRX
The price is moving in an upward trend in blue on a 2-day frame, and the price adheres to it
We have a higher stability moving average of 100
The RSI indicator has a long-term uptrend
The stop is below the uptrend if it is broken
Entry price is 0.1243
The first target is 0.1312
The second target is 0.1378
The third goal is 0.1456

TRXtron first target
it is the first step to make tron top 10.
tron market cap is suitable to be about $ 50B.

TRX Long practice As I practice strengthen my skill I believe price to drop touching lows this upcoming week

Touching the HA-Low indicator means...Hello traders!
If you "Follow" us, you can always get new information quickly.
Please also click “Boost”.
Have a good day.
-------------------------------------
(TRXUSDT 1M chart)
It appears that a new HA-High indicator is about to be created.
Accordingly, we need to check whether the HA-High indicator is generated at the 0.10447 point.
If the HA-High indicator is created at the 0.10447 point, the key is whether it can be supported and rise around that area.
(1W chart)
The key is whether the price can be maintained by receiving support in the current section and rising above 0.13052.
If not, and it falls below 0.786 (0.11732), it is likely to fall to around 0.618 (0.10288).
If it falls like that, there is a high possibility that it will turn into a downward trend, so you need to think about ways to respond to the decline.
(1D chart)
The HA-Low indicator was first touched on August 20, 2023, and then again on March 21, 2024.
Accordingly, the key is whether it can be supported and rise around 0.12002, which is the point where the HA-Low indicator is currently formed.
The HA-Low indicator is an indicator that indicates the boundary of the low point section.
Accordingly, support from the HA-Low indicator can be said to mean that a bottom section is forming.
If it falls below the HA-Low indicator, it means that the low point is renewed, and a cascading decline is likely to continue.
Therefore, a trading strategy should be created depending on whether support or resistance is found around 0.12002, which is the currently formed HA-Low indicator point.
Since the MS-Signal indicator is formed around 0.12296, the key is whether it can rise above 0.12296.
If that happens, there is a high possibility that it will rise near the HA-High indicator, so there is a possibility that it will rise to around 0.13997, which is the point where the HA-High indicator is currently formed.
However, as the price rises, there is a possibility that a new HA-High indicator will be created, so if a new HA-High indicator is created, support must be received near it to continue the upward trend.
TRX is one of the coins that is expanding the coin ecosystem.
I think it will be a good textbook for expanding the coin ecosystem I selected and understanding the trend as the first coin to touch the HA-Low indicator.
Have a good time.
thank you
--------------------------------------------------
- The big picture
The full-fledged upward trend is expected to begin when the price rises above 29K.
This is the section expected to be touched in the next bull market, 81K-95K.
#BTCUSD 12M
1st: 44234.54
2nd: 61383.23
3rd: 89126.41
101875.70-106275.10 (when overshooting)
4th: 13401.28
151166.97-157451.83 (when overshooting)
5th: 178910.15
These are points that are likely to encounter resistance in the future.
We need to see if we can break through these points upward.
Since it is thought that a new trend can be created in the overshooting area, you should check the movement when this area is touched.
#BTCUSD 1M
If the general upward trend continues until 2025, it is expected to rise to around 57014.33 and then create a pull back pattern.
1st: 43833.05
2nd: 32992.55
-----------------

TRX Tron Consolidation AreaIf you haven't sold TRX when the retracement started:
Now, I think we are going to see TRX Tron trading in the consolidation area, between $0.10 and $0.12 for the next week or so.

TRX- USDT...HINT- Ticking Bomb! 💣🔥 23/03/24With ENTRY area @ 0.12050 or around it is not too late to "jump in".
TP @ 0.13634 or around...
WARNING ⚠️: TREAT COUTIOUS, COS IT IS A "TICKING BOMB"!
It can make a "crazy" dance all over chart before going to hit TP! Don't gamble & properly trade only....!
It was done using purely technical analysis only... & only...😁
PS: not able to post many more trades, which one in the progress or just endup in profit , cos of lack spare time , sorry....over incoming weekend I will try to share majority of them ..
Live Long & Prosper!🖖

TRXUSDT: Fast Trend Holding On and Targeting 17 CentsTRX recently Bearishly reversed after testing the upper bound of a Bearish Butterfly, now TRX has pulled back to the faster trend line. If the Faster Trend on TRX Continues to hold out, as it has several times already, I think Tron could attempt to make a higher high which could lead to it reaching the ultimate 3.618 Fibonacci Target off the back of Hidden Bullish Divergence.

TRXUSDT: Hanging Man at the PCZ of a Bearish ButterflyTron has confirmed a Hanging Man just above the PCZ of a Bearish Butterfly, it starts to play out I think it will come back down to meet the trend line at the 61.8% retrace as the current move above trend also happens to be a bit overextended.
