Brief Analysis ——TRXToday, we bring a brief analysis of two more popular tokens. They are TRX and DYDX.
From the beginning of 2023, TRX rose with fluctuation and the price maintained a movement within the bullish channel (green range). Even on June 10th, when the SEC brought FUD to the whole market, the fall of TRX was not destructive. After that, the price returned to the previous high again. Recently, the price attacked the resistance level 0.085 twice but failed. Subsequently, the bears gained power and three long red candles formed. The fall was accompanied by increased volume, and there does not seem to be any strengthening for the bulls.
Conclusion: The high probability fall has not ended. On a large scale, TRX remains bullish, but on a small scale, bears was much ahead. So we come to this conclusion. The bulls may gain strength after the price approaches the green dotted line. We set this week's resistance level at 0.085 and support level at 0.068.
If you have any ideas, welcome to communicate with us:)
Disclaimer: Nothing in the script constitutes investment advice. The script objectively expounded the market situation and should not be construed as an offer to sell or an invitation to buy any cryptocurrencies.
Any decisions made based on the information contained in the script are your sole responsibility. Any investments made or to be made shall be with your independent analyses based on your financial situation and objectives.
TRXUSDT_26B410 trade ideas

TRX Elliot Wave AnalysisAs indicated on the chart, the elliot wave cycle is completed
This is only a SPOT TRADE.
TAKE PROFIT : Levels mentioned in blue dotted lines.
STOPlOSS : Use accordingly
It can go oppsoite if btc dumps so do proper Risk Management.
NFA, DYOR

TRX: Channel Up BreakoutTRON (TRX) technical analysis:
Trade setup : Price was trading in Channel Up pattern but got rejected at $0.086 resistance again, just as it did in June. Now it had a bearish breakout from Channel Up pattern and below $0.08 support. Price could pull back near $0.073 support, which could be an attractive swing entry in Uptrend.
Pattern : Price was trading in a Channel Up pattern. With complete patterns (i.e. a breakout) – initiate a trade when the price breaks through the channel’s trendlines, either on the upper or lower side. When this happens, the price can move rapidly in the direction of that breakout.
Trend : Uptrend across all time horizons (Short- Medium- and Long-Term).
Momentum is Bearish (MACD Line is below MACD Signal Line, and RSI is below 45).
Support and Resistance : Nearest Support Zone is $0.080, which it broke, then $0.073. The nearest Resistance Zone is $0.086, then $0.100.

TRX usdt 5/15 min timeframe Long idea tp1 is orange line
and i think after making a double top trx can rich to 0.08838 usdt

TRX/USDTTron digital currency is in an upward trend and in the short term it can reach 0.10 cents, if this resistance is broken, the long-term goal of this currency is 0.17 cents. Good luck.

✴️ Tron Ascending Channel With Targets (115% Potential)Tron (TRXUSDT) has been growing since March 2020, higher highs and higher lows, more than 3.3 years.
We will not go that far back but instead will focus on current price action.
We see a nice uptrend, ascending channel, since November 2020 and the chart signals are telling me that this pair is about to pick up momentum.
✔️ EMA300 and EMA200 were tested as support recently, last month, and held beautifully.
✔️ Now we are seeing five 3D sessions closing green, that's 15 days of green with prices trading above EMA10 and EMA21.
✔️ The MACD is above zero and about to print a bullish cross with a strong RSI.
This all points to higher prices with the main support being at EMA50 (0.0698) and EMA300 (0.0660).
Now the targets:
1) The first jump can produce 55% at around $0.121.
2) The second jump can reach higher and hit 116% at $0.167.
These are easy targets for this bullish wave.
Namaste.

TRX/USDT 1DAY UPDATE BY CRYPTOSANDERS !!Hello, welcome to this TRX/USDT update by CRYPTO SANDERS.
CHART ANALYSIS:- Tron (TRX) extended a recent bull run for a fourth day, with today’s move taking the token to its highest point since last Sunday
Following a low of 0.08221 on Thursday, TRX/USD climbed to an intraday high of 0.08417 earlier in today’s session.
Tron bulls appear to be targeting a resistance level at 0.0860, which was last hit during last Saturday’s peak of 0.0943.
Since hitting that 20-month high TRX has mostly consolidated, however bullish momentum seems to be gradually returning.
This comes after the relative strength index (RSI) moved beyond a ceiling of its own at 63.00, and is now tracking at 64.84.
If the current sentiment remains, TRX could reach 0.0860 in the coming days.
I have tried to bring the best possible outcome to this chart.
Hit the like button if you like it and share your charts in the comments section.
Thank you

TRX/USDT 15M LONG1.The 15M bar have getting price higher(MSB).
2.Swing low be taken,Price trend towards the Weekly Open(or Monday High). 0.08342

TRXUSD ❕ buyers have strengthenedRSI is moving above neutral values.
Price has fixed above 50EMA at 4H TF.
50EMA has broken above 200EMA on 30m TF.
I believe the asset will continue to rise if it holds support.

TRXUSD short till support TRXUSD is in a rising channel
Price resisted at the strong resistance at 0.0900 and is now trading at 0.08067 with a possible drop to 0.07280 before testing the 0.0900 resistance again
The drop is a potential 10% dump

#TRXUSDT #LQR #TOBTC #LaqiraProtocolSupport and resistance that are obtained from the confluence of static and fib levels are specified in the chart. After confirming and matching with Bitcoin levels, you can open a position If Break dynamic support and confirmation. You can open a sell position This analysis is not an offer to buy or sell

TRXUSDT IDEA HELLO GUYS THIS MY IDEA 💡ABOUT RXUSDT is nice to see strong volume area....
Where is lot of contract accumulated..
I thing that the buyers from this area will be defend this LONG position..
and when the price breakout this resistance , strong buyers will be push up the market again..
IF you like my work please like and follow thanks

Tron [TRX] to rebound from this ascending trendline support?Price action faced rejection at the bearish order block (OB) on H12, which aligns with the June high. Price edged lower towards a key ascending trendline support and could for new buying opportunities if the support holds.
Entry - $0.07899
Target - $0.08259
Exit - $0.07800
RR - 3.46

Swing trading futures with leverageIf you don't understand anything, then this is a hopeless long from Justin Sun.

TRX (TRON) Coin Analysis 08/05/2021Fundamentals:
TRON is a blockchain-based operating system that aims to ensure this technology is suitable for daily use. Whereas Bitcoin can handle up to six transactions per second, and Ethereum up to 25, TRON claims that its network has capacity for 2,000 TPS.
This project is best described as a decentralized platform focused on content sharing and entertainment — and to this end, one of its biggest acquisitions was the file sharing service BitTorrent back in 2018.
Overall, TRON has divided its goals into six phases. These include delivering simple distributed file sharing, driving content creation through financial rewards, allowing content creators to launch their own personal tokens and decentralizing the gaming industry.
TRON is also one of the most popular blockchains for building DApps.
Using the blockchain and its decentralized smart contract capability, the idea of Tron is that users will experience a decentralized internet where “middlemen” such as Google and Facebook are not needed for users to access content.
To draw an example, currently the most ubiquitous video sharing platform is Youtube, which is a privately owned company with privately owned servers that stores and serves video to its viewers. However, using Youtube’s services means that creators and users have to comply with Youtube's terms of service and may have to pay for its content in one way or another. Creators on the Youtube platform may earn a share of Youtube’s revenue, but the pay structure is entirely up to Youtube’s discretion.
The TRON protocol runs on a Delegated Proof of Stake (DPoS) Governance Model. This allows users to perform transactions with close to zero-fee whilst still being resistant towards transaction spam.
Transactions on the Tron Blockchain are maintained by a consortium of Super Representatives (SR) that are voted in by TRX holders who have locked their stake in the form of Tron Power. There are 27 top-voted Super Representatives and 100 Super Representative Candidates. The hierarchy of SR and SR Candidates are readjusted every 6 hours based on the number of votes they receive from Tron Power holders.
Tron aims to replace services such as Youtube and others by becoming the decentralized infrastructure in which users can connect directly with creators and pay the creators directly for the content they wish to consume.
TRON has positioned itself as an environment where content creators can connect with their audiences directly. By eliminating centralized platforms — whether they are streaming services, app stores or music sites — it is hoped that creators won’t end up losing as much commission to middlemen. In turn, this could also make content less expensive for consumers. Given how the entertainment sector is increasingly becoming digitized, TRON could have a headstart in applying blockchain technology to this industry.
The company also says that it has a talented and experienced developer team, based around the world, that has been drawn from major companies such as Ripple Labs.
Last but not least, whereas some other blockchain projects can be opaque about their plans for development, TRON offers a point of difference by delivering a roadmap that shows its intentions for the coming years.
TRON uses a consensus mechanism that is known as delegated proof-of-stake.
TRX owners can freeze their cryptocurrency in order to get Tron Power, which means that they can vote for “super representatives” who serve as block producers.
These block producers receive TRX rewards in exchange for verifying transactions, and these rewards are then distributed among the people who voted for them.
According to TRON, this approach helps its blockchain to achieve higher levels of throughput.
TRON was founded by Justin Sun, who now serves as CEO. Educated at Peking University and the University of Pennsylvania, he was recognized by Forbes Asia in its 30 Under 30 series for entrepreneurs.
Born in 1990, he was also associated with Ripple in the past — serving as its chief representative in the Greater China area.
TRON has a total supply of just over 100 billion tokens — and at the time of writing, about 71.6 billion of these are in circulation.
When a token sale was held in 2017, 15.75 billion TRX was allocated to private investors, while an additional 40 billion were earmarked for initial coin offering participants. The Tron Foundation was given 34 billion, and a company owned by Justin Sun got 10 billion.
All in all, this meant that 45% of TRX supply went to the founder and the project itself, while 55% was distributed among investors. Critics argue that this is a much higher ratio than what has been seen with other cryptocurrency projects.
TRON price today is $0.152468 with a 24-hour trading volume of $5,391,785,654. TRX price is down -6.9% in the last 24 hours. It has a circulating supply of 72 Billion TRX coins and a max supply of 101 Billion. Binance is the current most active market trading it.
Technical Analysis:
As you can see in the Daily chart , Tron coin Value have increased from the end of April to end of March 2021 and it reached 0.18$ each. The Coin has touched Fibonacci Golden Zone and Bounced from it, What we think is that the price may fluctuate and Reaccumulate between 0.12$ and 0.16$ in order to Get ready and accumulate enough volume to shoot for TP1 ( 0.23$) and ultimately higher targets levels, which are specified by Fibonacci Projection of the Initial Impulsive Cycle.
There are few Support levels specified by Fibonacci Retracements which can stand in case of some More Fall downs.

trx long fastWe notice the bearish trend line has been broken
And the entry of liquidity into the market
It is not a requirement for a correction of the entry area, it may rise from the current price
I apologize that my English is not good
Good luck to all
target
0.0825$
stop lose
0.0789$
Did you like my analysis? Leave a comment, like, and follow to get more

15m quick trade setupLet's see if this trade setup works out, we have to close some sort of candle in the area circled, before the setup becomes vaild. This should apply to most other coins too.

TRX ANALYSIS (4H)Hi, dear traders. how are you ? Today we have a viewpoint to SELL/SHORT the TRX symbol.
For risk management, please don't forget stop loss and capital management
When we reach the first target, save some profit and then change the stop to entry
Comment if you have any questions
Thank You

TRXUSDT SHORT OPPORTUNITYTRXUSDT is in an uptrend and after reacting to a strong fresh OB, firstly broke the OB then got back beneath it and made a ChoCh, then I personally set my short setup, and I will enter in lower time frame in 15M and 5M, based on my checklist confirmation and risk and money management!
But as you know the analyzing timeframe is 4H and the triggering orders might take time, hence as you might know tomorrow there will be data, MCSI (Michigan consumer sentiment index) which is very important for dollar. So be careful at that time, DYOR and be profitable!
Ciao!

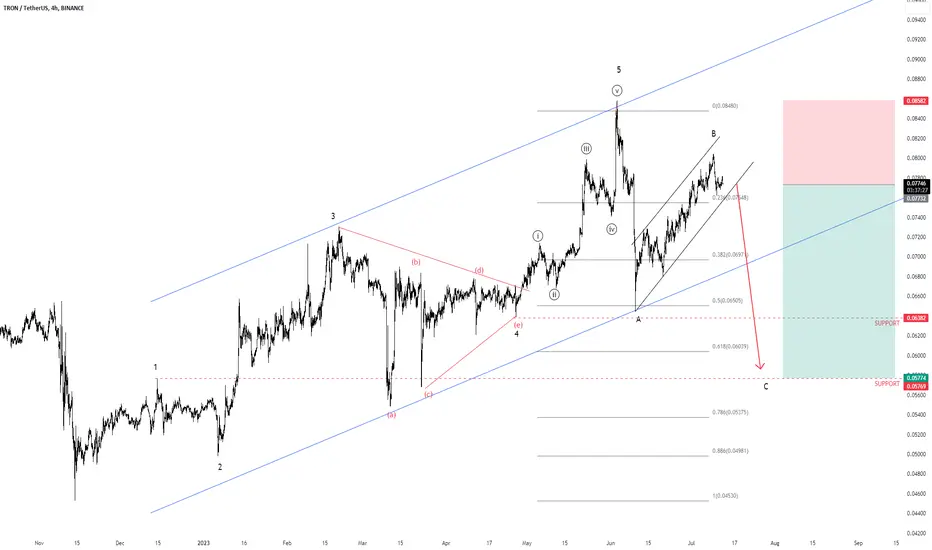
$TRX $TRON SHORT SETUPHey bros,
Short TRX for wave C. TP & SL is on the chart.
Goodluck & dont forget to follow me.
TRX: Possible Bearish CorrectionTRX: Possible Bearish Correction
We have seen that TRX has been in a strong bullish movement and it has reached the previous year's price high before the BTC crash.
All that bullish movement happened very quickly and without any strong reason.
We all know that TRX has been part of large manipulations and they had also a problem with the SEC.
Probably now it's the time for profit-taking.
Thank you and Good Luck!

TRXHi....
usually i am not in such a risky position like this .... see this chart ...huge amount of candles inside two big red candle are creeping up weakly and i recommend you to close your longs in TRX maybe it goes higher but the risk reward ratio now in this chart is not worth it ......
Good luck

TRX: indicator for short!Hello colleagues!
🔎Globally, the price is in an ascending structure. For 791 days there is a corrective movement with the accumulated liquidity on the forehead side. There is a liquidity point above at $0.09279, which will be the target for growth.
🔎A large pool of liquidity has formed on the weekly TF from below, which will become "fuel" for a decline to $0.04526
🔎On the daily TF, there is a corrective movement towards the falling wave. Now there is a local reaction to the filled imbalance, which may lead the price to decrease.
❗️Not a financial recommendation, before entering into a particular transaction, conduct an analysis of the asset yourself.
