Trx long to $0.25441Trx was consolidating for a bit but recently showed signs that its likely to breakout to the upside. I took aposition here
Stop: $0.24551
Target: $0.25441
Dtt strategy applied
TRXUSDT_26B410 trade ideas

TRX/USDT – Bullish Momentum Valid While Holding Above 0.2TRON recently broke market structure to the upside, which confirms a potential shift out of the long-term accumulation range. This bullish break is technically supported by several elements that suggest continuation, as long as price action respects key levels.
Price is currently:
Above the Ichimoku cloud, with Span A at $0.2473 and Span B at $0.2404, which confirms the directional bias is shifting in favor of the bulls.
Above the Point of Control (POC) of the entire accumulation range, it is now trading where the highest traded volume occurred — a strong base for further expansion.
The Trend Strength Index (TSI 20) is turning positive (0.22), showing the beginning of a momentum shift. Meanwhile, TSI 10 is at -0.13, suggesting short-term momentum is still neutral or cooling, which aligns with the idea of a possible pullback before continuation.
Scenarios to Watch:
Optimal Entry (Pullback):
The zone between $0.2248 and $0.2009 is an important support level where price has previously reacted and where resistance was once found. This structural shift from resistance to support adds significance to the area. Even though it is currently below the Ichimoku cloud, the price's historical behavior makes it a key zone to watch for potential bullish entries during a pullback.
Breakout Confirmation:
A clean break and close above $0.2597 (previous swing high) would confirm bullish continuation.
A retest of $0.2597 following a breakout would provide a secondary entry opportunity.
Upside Target:
The projected move points to $0.44, based on the measured range expansion from the breakout, which also coincides with the next major resistance area.
Trade Setup Summary:
Buy Zone 1: $0.2248 – $0.2009
Buy Zone 2 (break and retest): Above $0.2597
Target: $0.44
Invalidation: Close below $0.2000
Trend Bias: Bullish while above $0.2000
TRON remains one of the most active Layer 1 blockchains in terms of daily transactions and stablecoin usage, especially USDT transfers. While it doesn't enjoy the same spotlight as Ethereum or Solana, TRON has been quietly expanding its DeFi ecosystem and maintaining strong on-chain activity. Recently, its growing integration with BitTorrent and cross-chain interoperability initiatives have boosted sentiment. Additionally, the recent stabilization of broader market conditions increases the likelihood that breakout plays like TRX can attract renewed capital rotation during altcoin cycles.
Disclaimer: This content is for educational and informational purposes only. It does not represent financial advice or a recommendation to buy or sell any financial instrument. Trading involves risk, and you should only trade with money you can afford to lose.

TRX setting up a FOMO Scenario on DailyIs Justin Sun setting us up for FOMO with TRX? Daily is accumulating. is it for an explosion up, or down? I have no additional information than what's portrayed in the picture. Plenty of room for MFI, break out is another tap of the upper BB Band, and momentum is clearly ready to just go up. my guess is this is a breakout trade already started but who knows. So hard to tell and our boy Justin S can stay way more solvent then you can and way longer. he can keep prices down for years if he wanted to. But, I like our chances here. SL would be a bottom bb band touch before an upper band touch. this is a spot only trade. If break out is up, people will FOMO this and they may not be wrong.

Lingrid | TRXUSDT broke CONSOLIDATION zone. Potential LongThe price perfectly fulfilled my last idea . It hit the target level. BINANCE:TRXUSDT market has decisively broken through the 0.2500 psychological level and consolidation zone with an impulse leg. Additionally, it has broken through the downward trendline, confirming the strength of this move. On the higher timeframe, the market is forming an ABC pattern, suggesting that price may reach the resistance zone around 0.2780. I expect a pullback in the near term, which would likely present a buying opportunity, followed by continuation of the bullish trend. My goal is resistance zone around 0.2595
Traders, if you liked this idea or if you have your own opinion about it, write in the comments. I will be glad 👩💻

TRX/USDTThe coin has a macro bullish structure. After a correction, it’s been in accumulation for 127 days. Upside targets are 0.33–0.44

Tron Eternal Uptrend ContinuesThis is good news for the overall market. Tron continues to grow.
If we give a closer look to this chart, we can notice a rounded/cup pattern developing after the last correction and this is a strongly bullish development.
The action is moving above the base (blue line) of the pattern and this is what makes this chart structure super bullish.
Support was found also on the middle trendline of the long-term rising channel. The uptrend that has been present since November 2022.
TRXUSDT is set to continue growing long-term.
It is true that Tron is its own economy and has a real working product, or else the chart wouldn't look like this. A chart like this says that something positive is happening behind the scenes. All conditions for this trading pair and Cryptocurrency project continue to be green.
Namaste.


TRX USDT LONG TRADE SETUPTRX is currently holding at a strong support level , with a high probability of a bounce. Additionally, other indicators, such as the 200 EMA, are also acting as support . There is a high chance of it moving upwards.

Tron Potential DownsidesBINANCE:TRXUSDT
Hey Traders, in today's trading session we are monitoring Tron for a selling opportunity around 0.25 zone, Tron is trading in a downtrend and currently is in a correction phase in which it is approaching the trend at 0.25 support and resistance area.
Trade safe, Joe.

TRXUSDT TRXUSDT Price Action Analysis (1H Timeframe)
🔹 Overall Trend: After a strong rally, the price is in a correction phase, currently trading at 0.2291. The key resistance at 0.2300 must be broken for a bullish continuation.
🔹 Bullish Scenario:
A breakout above 0.2300 with confirmation could push the price towards 0.2345 and 0.2435.
If this happens, the bearish structure will be invalidated, increasing bullish momentum.
🔹 Bearish Scenario:
Failure to break 0.2300 may lead to a pullback towards 0.2250 and 0.2205.
Losing 0.2205 could open the way for a deeper drop to 0.2160, a critical support zone.
🎯 Conclusion: Watch key levels closely; a confirmed breakout above 0.2300 signals a buy opportunity, while losing 0.2250 strengthens the bearish outlook.

Lingrid | TRXUSDT bullish STRUCTURE with Potential ENTRY Zone The price perfectly fulfilled my last idea . It hit the target level. BINANCE:TRXUSDT is showing a strong bullish momentum making higher lows and higher highs. On the daily timeframe, the market is rolling back after forming higher highs. There's a possibility that the price might pull back toward the support level, dipping below the psychological round number at 0.240. I think if the price rejects the upward trendline, weekly high and support level there is great chance of trend continuation. This correction might provide an opportunity for buyers to enter, with the potential for the price to retest the recent higher high level afterwards. 📈 Keep an eye on these key levels for optimal entry points. My goal is resistance zone around 0.2530
Traders, if you liked this idea or if you have your own opinion about it, write in the comments. I will be glad 👩💻

TRXUSDT (TRON) End of correction and Bullish Starting PointBased on the presented chart, it is observed that TRON is undergoing a corrective phase. This correction may extend to the level of 0.2421. It is anticipated that after reaching this level, a new upward trend in TRON's movement will commence

Tron (TRX): Possible Smaller Correction To Lower Zones Tron coin has recently filled the bullish CME gap with a decent liquidity-hunting candle, where now we see the dominance is back in the hands of sellers.
We have put 2 points of interest zones for us where we will be looking for some kind of re-test to happen before another movement to upper zones.
Swallow Team

TRXUSDT TRON $TRX #bullish #breakingout #trend #longbaseIn a tough market after a sideways movement, it has broken out. If it kicks on from here, it will run to 0.30 imo. Time to add on and scale with conviction.

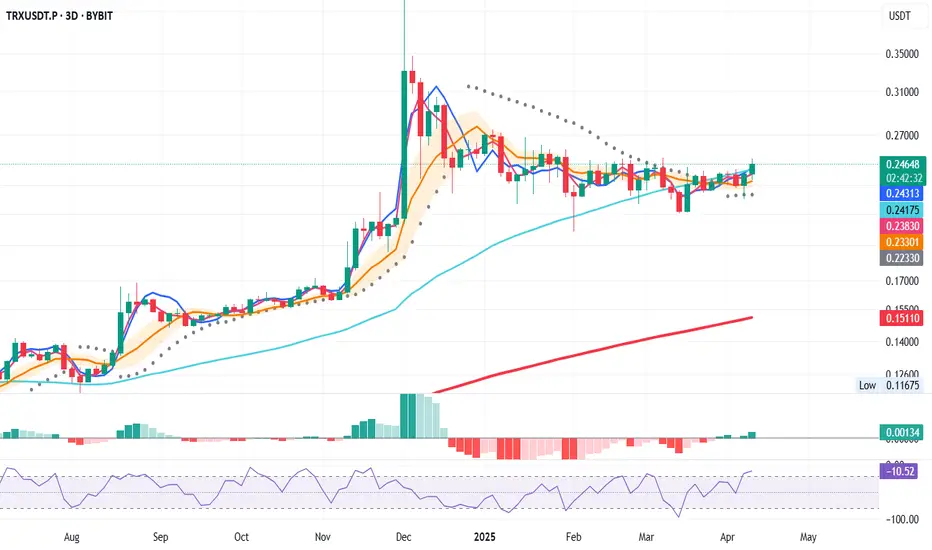
TRXUSDT – Bullish System Trigger (3D Chart)
📅 April 13, 2025
Today’s 3D bar close offers a strong bullish signal, aligning multiple system indicators in favor of a long entry.
Here’s what the system confirms:
✅ Price closed above the 50 MA – bullish structure
✅ MLR > SMA > BB Center – solid confluence
✅ Price > PSAR – trend shift confirmed
✅ Above the 200 MA – long-term trend support
Entry Strategy
- Open long at the 3D bar close
- Stop-loss below the latest PSAR dot for system integrity
📌 Note: This is a system-based entry — not a prediction.
TRXUSDT Eyes Breakout Amid Bullish StructureThe TRXUSDT market appears to be forming an ABC extension pattern, characterized by a series of higher lows, while the highs remain relatively flat. The price has been consistently testing the 0.2400 resistance area, indicating the possibility of a breakout and a sustained move above this level. Recently, the price surpassed the previous week's high, which may signal either a short-term pullback or continued upward momentum. A retest of the support zone is anticipated before the market potentially resumes its upward trend. The next key resistance level is projected around the 0.2500 mark

Lingrid | TRXUSDT short-term BULLISH move in CONSOLIDATION zoneThe price perfectly fulfilled my last idea . It reached the target level. BINANCE:TRXUSDT market is forming an ABC extension pattern and has established higher lows, while the highs remain relatively equal. Price continues to test the 0.2400 resistance zone, and I anticipate a potential breakthrough and close above this level. Recently, price broke above the previous week's high, suggesting it may either pull back or continue moving upward. However, I expect price to retest the support zone before resuming its upward trajectory. My target is resistance zone around 0.2500
Traders, if you liked this idea or if you have your own opinion about it, write in the comments. I will be glad 👩💻

TRX iHVF 12HTRX setting up for a iHVF to 0.1810. 8.5 RRR. Exit pump considering macro environment. Stop loss at assumed second impulse low (high). Target from first impulse draw brought to second impulse low (high), potential for over/under performance.

Be careful with TRX !!!As you can see, the price has now formed an ascending wedge , which is promising. The price could rise to $0.27 after breaking this wedge...
Give me some energy !!
✨We spend hours finding potential opportunities and writing useful ideas, we would be happy if you support us.
Best regards CobraVanguard.💚
_ _ _ _ __ _ _ _ _ _ _ _ _ _ _ _ _ _ _ _ _ _ _ _ _ _ _ _ _ _ _ _
✅Thank you, and for more ideas, hit ❤️Like❤️ and 🌟Follow🌟!
⚠️Things can change...
The markets are always changing and even with all these signals, the market changes tend to be strong and fast!!

Liquidity Grab Ahead? Why TRX (Tron) May Retrace Soon TRX (Tron) is currently trading near a significant resistance zone, aligning with the upper boundary of a descending channel on the 4-hour timeframe 📉. This area is likely to hold liquidity in the form of buy stops resting above the previous range highs. Given the broader downtrend and the strong resistance overhead, the price may retrace as it taps into this liquidity pool.
This setup presents a compelling short opportunity, with the expectation that TRX will reject this level and move lower, targeting support zones below. Traders should remain cautious and monitor price action closely for confirmation before entering a position ⚠️.
Disclaimer: This analysis is for informational purposes only and does not constitute financial advice. Cryptocurrency trading involves significant risk, and you should consult with a financial advisor before making any investment decisions. Always trade responsibly! 🚨

TRXUSDT Breakout detected, Accumulate!!Join our community and start your crypto journey today for:
In-depth market analysis
Accurate trade setups
Early access to trending altcoins
Life-changing profit potential
Let's analyze TRXUSDT:
TRX has broken out after prolonged consolidation, signaling strong potential. Fundamentally and technically, TRX appears robust. An ascending triangle breakout suggests bullish momentum. Accumulate TRX now to capitalize on this upward trend. This breakout indicates a significant price movement is likely.
Resistance zone: $0.2540- $0.2614
Target 1: $0.2735
Target 2: $0.3010
Target 3: $0.3391
If you find this analysis helpful, please hit the like button to support my content! Share your thoughts in the comments, and feel free to request any specific chart analysis you’d like to see.

TRXUSDT 1D LONG [UPdate]In line with the expectations I outlined in my main TRXUSDT 1D LONG review the price interacted perfectly with the key liquidity block and turned around confidently.
To feel safe in this position, I move the stop order to breakeven and continue to wait for my targets to be reached!
Targets:
$0.2509
$0.2580
$0.2679
$0.2815

TRXUSDT accumulation zone, support & resistance!!Join our community and start your crypto journey today for:
In-depth market analysis
Accurate trade setups
Early access to trending altcoins
Life-changing profit potential
Let's analyze TRXUSDT:
TRXUSDT is currently in a prolonged consolidation, mirroring a prior 80-day phase that triggered a 165% surge. After 100 days of similar accumulation, TRX is oscillating within a demand zone of $0.2106-$0.2218, facing resistance at $0.2540-$0.2614. A decisive break above this resistance could propel TRX towards higher targets, capitalizing on the extended accumulation period and historical breakout patterns.
Resistance zone: $0.2540- $0.2614
Accumulation zone: $0.2106-$0.2218
Target 1: $0.3010
Target 2: $0.3391
Long-term target: 80% -100%
If you find this analysis helpful, please hit the like button to support my content! Share your thoughts in the comments, and feel free to request any specific chart analysis you’d like to see.
Happy Trading!!
